High-throughput imaging, computation, morphometrics, and visualization - PowerPoint PPT Presentation
1 / 1
Title:
High-throughput imaging, computation, morphometrics, and visualization
Description:
32 GB/scan (raw file), 1-5 scans/fish Tomographic reconstruction= 2048 x 2048 x 2048 volume/scan ... Cray Gemini, 3D torus (160GB/s BW, – PowerPoint PPT presentation
Number of Views:38
Avg rating:3.0/5.0
Title: High-throughput imaging, computation, morphometrics, and visualization
1
High-throughput imaging, computation,
morphometrics, and visualization for
morphological phenomics Keith Cheng1, Xuying
Xin1, Stephen Peckins1, Jean Copper1, Darin
Clark1, Donald Bigler 2, Rajkumar Kettimuthu3,
Xianghui Xiao4, Francesco De Carlo4, Patrick La
Riviere5, Gordon Kindlmann3,6, Jonathan
Silverstein3,5,6, and Ian Foster3,6 1Jake Gittlen
Cancer Research Foundation, Division of
Experimental Pathology, 2Dept of Radiology, Penn
State Hershey College of Medicine, 3Mathematics
Computer Science Institute, 4Advanced Photon
Source Argonne National Lab, 5Dept of Radiology,
6Dept of Computer Science, U Chicago
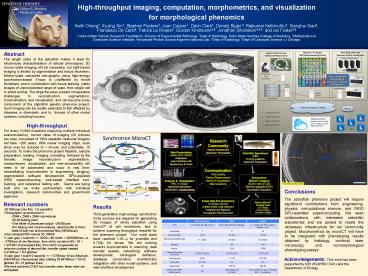
- Abstract
- The length scale of the zebrafish makes it ideal
for whole-body characterization of cellular
phenotypes. 3D micron-scale imaging will be
necessary, but light-based imaging is limited by
pigmentation and tissue thickness. Micron-scale
computed tomography using high-energy
synchrotron-based X-rays is unaffected by those
limitations, and in combination with tissue
staining, yields images of unprecedented range of
scale, from single cell to entire animal. The
large file-sizes present conquerable challenges
to reconstruction, segmentation, morphometrics,
and visualization, and can become a key component
of the zebrafish genetic phenome project. Such
imaging can be readily extended to fish affected
by diseases or chemicals, and to tissues of
other model systems, including humans. - High-throughput For every 10,000 mutations
(requiring multiple individual scans/mutation),
current rates of imaging (20 minutes per scan
comprised of 1504 separate rotational images)
will take 200 years. With newer imaging chips,
scan times may be reduced to 1 minute, and
potentially, 10 seconds. To make the phenome
project feasible, sample preparation, loading,
imaging, unloading, followed by file transfer,
image reconstruction, segmentation, measurement,
visualization, and web-accessibility will need to
be automated and occur in real time,
necessitating Improvements in engineering,
imaging, segmentation software development,
GPU-assisted GRID supercomputing, web-based
interface tool-building, and reiterative testing
with. Teams are being built and we invite
partnerships with individual investigators,
research communities and government agencies. - Relevant numbers
- 32 GB/scan (raw file), 1-5 scans/fish
- Tomographic reconstructiongt
- 2048 x 2048 x 2048 volume/scan
- 32-bit floating point
- One folder of processed output 24GB/scan
- For backup and volume analysis, need transfer to
Penn State of both raw and processed files
(56GB/scan) - One computed fish volume 20-100GB
- 1 year goal 1 scan/min gt 32GB x 60 min/hr
2020GB/hour, or 2TB/hour of raw files/scan, from
which we derive 60 x 24 1.44TB/hr of processed
files, from which we generate an unknown number
of derived files transfer speed needed
3.4TB/hour 8.3 gbit/sec - 3 year goal 1 scan/10 seconds gt 12TB/hour of
raw files/scan, 8.64TB/hour of processed data,
totaling 20.64TB/hour 50.43 gbit/sec (6 x 10
gbit/sec lines) - We have achieved 2TB/2 hour transfer rates
faster rates are anticipated
Conclusions The zebrafish phenome project will
require significant contributions from
engineering, physics, computational science, and
GRID GPU-assisted supercomputing. We seek
collaborations with interested zebrafish
laboratories and are poised to create the
necessary infrastructure for our community
project. Morphometrics by microCT will have to be
integrated with phenotyping results obtained by
histology, confocal laser microscopy and
nonmorphological phenotyping assays.
Results Third-generation high-energy synchrotron
X-ray sources are required for generating 3D
images of whole zebrafish using microCT at cell
resolutions, and to achieve scanning throughput
required for the phenome project. Our voxel
sizes have reached 1.43 µ for juveniles and
0.743µ for larvae. We are working towards
improvements in scanning, data transfer speeds,
networking, software development, ontological
definition, database construction, bioinformatic
integration with other model systems, and
web-interface development.
New Mac laptop PADS Beagle
CPU 2.8-GHz 64-bit Intel Core i7 2.66-GHz 64-bit Intel Nehalem 2.1-GHz 64-bit AMD Opteron Magny Cours
Cores/node 2 8 24
Memory/node 8 GB 24 GB 32 GB
Memory bandwidth/node 17.1 GB/s 25 GB/s 85.3 GB/s
nodes 1 48 744
cores 2 384 17856
Peak performance (TFLOPS) 0.0224 TFLOPs 4.25 TFLOPs 151 TFLOPs
Total memory 8 GB 1.1 TB 23.3 TB
Node disk 512 GB n/a n/a
Shared disk n/a 350 TB 640 TB
Interconnect (MPI performance) n/a DDR Infiniband (20 Gb/s) Cray Gemini, 3D torus (160GB/s BW, lt1 µs latency)
Acknowledgements This work has been supported by
NIH (R24RR017441) and the Department of Energy.


