
Table 1 PowerPoint PPT Presentation
Title: Table 1
1
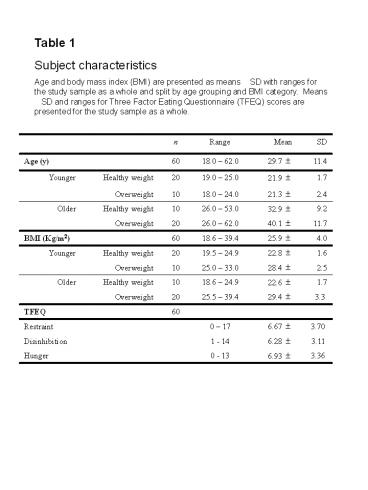
Table 1 Subject characteristics Age and body mass
index (BMI) are presented as means SD with
ranges for the study sample as a whole and split
by age grouping and BMI category. Means SD and
ranges for Three Factor Eating Questionnaire
(TFEQ) scores are presented for the study sample
as a whole.
n Range Mean SD
Age (y) 60 18.0 62.0 29.7 11.4
Younger Healthy weight 20 19.0 25.0 21.9 1.7
Overweight 10 18.0 24.0 21.3 2.4
Older Healthy weight 10 26.0 53.0 32.9 9.2
Overweight 20 26.0 62.0 40.1 11.7
BMI (Kg/m2) 60 18.6 39.4 25.9 4.0
Younger Healthy weight 20 19.5 24.9 22.8 1.6
Overweight 10 25.0 33.0 28.4 2.5
Older Healthy weight 10 18.6 24.9 22.6 1.7
Overweight 20 25.5 39.4 29.4 3.3
TFEQ 60
Restraint 0 17 6.67 3.70
Disinhibition 1 - 14 6.28 3.11
Hunger 0 - 13 6.93 3.36
Recommended
