
OGG1 PowerPoint PPT Presentation
1 / 1
Title: OGG1
1
OGG1
35
30
Control
25
UVB
20
Total RNA
15
10
5
0
11
2
3
4
5
6
7
8
9
10
Fraction
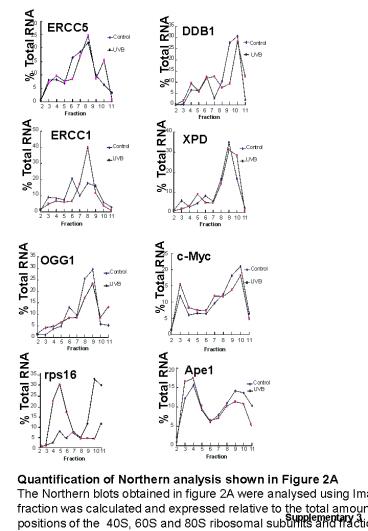
Quantification of Northern analysis shown in
Figure 2A The Northern blots obtained in figure
2A were analysed using Image Quant and the
relative amount of RNA in each fraction was
calculated and expressed relative to the total
amount of RNA. Fractions 4,5, and 6 correspond
to the positions of the 40S, 60S and 80S
ribosomal subunits and fractions 6-11 correspond
to the polysomes.
Supplementary 3
Recommended
