
Creating a Process Analysis infographic provides the opportunity to PowerPoint PPT Presentation
Title: Creating a Process Analysis infographic provides the opportunity to
1
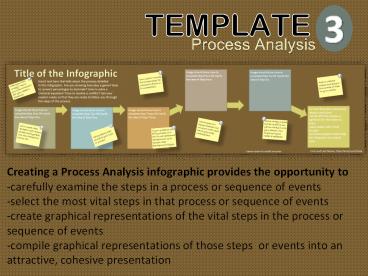
Creating a Process Analysis infographic provides
the opportunity to -carefully examine the steps
in a process or sequence of events -select the
most vital steps in that process or sequence of
events -create graphical representations of the
vital steps in the process or sequence of
events -compile graphical representations of
those steps or events into an attractive,
cohesive presentation
2
Title of the Infographic
Insert text here that tells about the process
detailed in this infographic. Are you showing how
play a game? How to convert percentages to
decimals? How to solve a chemical equation? How
to resolve a conflict? Get your readers ready so
that they are ready to follow you through the
steps of the process.
Image should show how to complete Step One OR
clarify the idea of Step One.
Image should show how to complete Step Two OR
clarify the idea of Step Two.
3
Image should show how to complete Step Four OR
clarify the idea of Step Four.
Image should show how to complete Step Three OR
clarify the idea of Step Three.
4
Image should show how to complete Step Six OR
clarify the idea of Step Six.
For your final spot, you should -draw a
conclusion -clarify WHY the process is
significant for the reader to know -leave reader
with a final thought -provided a graphic that
brings the infographic to a logical close
Leave room to credit sources
First and Last Name, Class Period and Date
Recommended
