pp65-specific PowerPoint PPT Presentation
1 / 3
Title: pp65-specific
1
B CD8 T-cells
A CD8 T-cells
pp65-specific
all
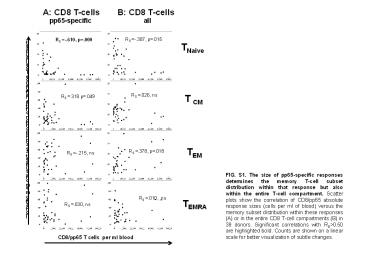
RS -.387, p.015
RS -.610, p.000
TNaive
RS .026, ns
T CM
RS .318 p.049
Indicated memory subset as a proportion of the
reference T-cell subset
TEM
RS .378, p.018
RS -.215, ns
FIG. S1. The size of pp65-specific responses
determines the memory T-cell subset distribution
within that response but also within the entire
T-cell compartment. Scatter plots show the
correlation of CD8/pp65 absolute response sizes
(cells per ml of blood) versus the memory subset
distribution within these responses (A) or in the
entire CD8 T-cell compartments (B) in 39 donors.
Significant correlations with RSgt0.50 are
highlighted bold. Counts are shown on a linear
scale for better visualization of subtle changes.
RS .010, ns
TEMRA
RS .030, ns
CD8/pp65 T cells per ml blood
2
A CD4 T-cells
B CD4 T-cells
pp65-specific
all
RS -.302, ns
RS -.530, p.001
RS -.142, ns
RS -.489, p.002
Indicated memory subset as a proportion of the
reference T-cell subset
RS .440, p.006
RS .573 p.000
FIG. S2. The size of pp65-specific responses
determines the memory T-cell subset distribution
within that response but also within the entire
T-cell compartment. Scatter plots show the
correlation of CD4/pp65 absolute response sizes
(cells per ml of blood) versus the memory subset
distribution within these responses (A) or in the
entire CD4 T-cell compartments (B) in 38 donors.
Significant correlations with RSgt0.50 are
highlighted bold. Counts are shown on a linear
scale for better visualization of subtle changes.
RS .304, ns
RS -.230, ns
CD4/pp65 T cells per ml blood
3
A
CD8 T-cells
T cells with 4 activation markers T cells with 3
activation markers T cells with 2 activation
markers T cells with 1 activation marker T
cells without activation markers
IFN-g
B
TNF-a
CD4 T-cells
FIG. S3. Polyfunctional T-cells display larger
quantities of each activation marker.
Representative dot plots show the expression
levels (MFI) of IFN-g and TNF-a of pp65/CD8 and
pp65/CD4 T-cell subsets displaying different
numbers of activation markers after stimulation
with pp65 for 16 hours. T-cells expressing no
(black), one (red), two (blue), three (green) or
four (orange) activation markers are shown. Dot
plots show log mean fluorescence intensities.
IFN-g
TNF-a

