FSU PowerPoint PPT Presentation
1 / 12
Title: FSU
1
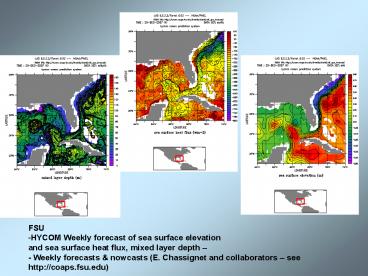
- FSU
- HYCOM Weekly forecast of sea surface elevation
- and sea surface heat flux, mixed layer depth
- - Weekly forecasts nowcasts (E. Chassignet and
collaborators see http//coaps.fsu.edu)
2
Modeling in the SECOORA Regionsupplied by Mark
Luther and Jyotika Virmani
3
HYCOM used to provide boundary conditions for
ROMS and for FVCOM in Eastern Gulf (Weisberg and
collaborators http//ocg.marine.usf.edu)
4
EFSIS drifters and also sea level and
depth-averaged currents
EFSIS sea level forecast compared to NOS station
East Florida Shelf Information System
(EFSIS) Developed under SEACOOS at RSMAS,
University of Miami by Prof. Christopher N.K.
Mooers and Dr. Inkweon Bang. See
efsis.rsmas.miami.edu/
5
Ruoying He at NC State Univ. is running a
shelf-scale circulation model based on the
Regional Ocean Modeling System (ROMS see
http//omglnx1.meas.ncsu.edu/MABGOM/)
6
SCOOP Storm Surge Model Based on ADCIRC (Advanced
Circulation Model for Coastal Ocean
Hydrodynamics) with Distributed GRID
Computing (see http//openioos.org/realtime/)
Collaborators Lavanya Ramakrishnan, Renaissance
Computing InstituteBrian O. Blanton, Renaissance
Computing InstituteHoward M. Lander, Renaissance
Computing InstituteRichard A. Luettich, Jr, UNC
Chapel Hill Institute of Marine SciencesDaniel
A. Reed, Renaissance Computing InstituteSteven
R. Thorpe, MCNC
7
USF STORM SURGE MODEL
USF/OCG using FVCOM to produce storm surge
simulations see ocg.marine.usf.edu
8
FSU and UF STORM SURGE MODELS
Chassignet and Morey and collaborators at
FSU/COAPS are using their models for storm surge
simulations (NCOM and HYCOM) See
http//coaps.fsu.edu/storm_surge.shtml
FSU
Peter Sheng at UF has storm surge models for
various sections of the Florida coast using the
CH3D (Curvilinear Hydrodynamics in Three
Dimensions) model (see http//ch3d.coastal.ufl.edu
)
UF
UF
9
High-resolution LIDAR for storm surge forecasting
- FIU
Dade County 3-D Images Rendered from Airborne
Laser Data. The image shows downtown Miami,
Florida looking Northwest Biscayne Bay. The data
was collected by an Optech ALTM 1233 topographic
mapping system operated by FIU. With major
funding from the Federal Emergency Management
Agency (FEMA) through the Florida Department of
Community Affairs, the Windstorm Simulation and
Modeling Project hopes to reduce hurricane
losses caused by storm surge. This three-year
program will contribute to improving the accuracy
and effectiveness of flood maps, surge atlases,
surge and flood models, and the process of
vulnerability assessment and mitigation.
Composite SLOSH and LIDAR storm surge
10
ESTUARIES
Simulated and observed water level UF (Sheng
et al. 2003)
One-week trajectory of five hypothetical
particles impacting the Atlantic ocean at various
times (between 49 and 300 seconds after the
shuttle launch).
A horizontal numerical grid for Indian River
Lagoon, St. Johns River, and a large coastal area
11
Biscayne Bay forecast from EFSIS
Depth-averaged current
USF Rookery Bay and Naples Bay
FIT
Lake Worth Lagoon
Goals Dredging versus salinity regime,
flushing, shoaling issues
Sebastian Inlet/IRL
12
Sewage Spill Trajectory
Desal Plant
Luther and Meyers at USF are using a version of
POM to model Tampa Bay in a Nowcast-Forecast to
provide a predictive capability for storm surge
prediction and mitigation, search and rescue,
environmental management/ permitting, and
hazardous material spills - See
http//ompl.marine.usf.edu
Phosphate Discharge Trajectory
Piney Point Phosphate Plant

