Fick principle for the measurement of cardiac output - PowerPoint PPT Presentation
1 / 18
Title:
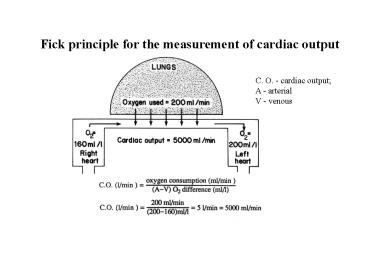
Fick principle for the measurement of cardiac output
Description:
A single compartment model for dye infusion. ... (b) a semilogarthmic plot of the dye concentration curve where B' portion of the ... – PowerPoint PPT presentation
Number of Views:1302
Avg rating:3.0/5.0
Title: Fick principle for the measurement of cardiac output
1
Fick principle for the measurement of cardiac
output
C. O. - cardiac output A - arterial V - venous
2
Figure 6.2. A single compartment model for dye
infusion. CBi - incoming dye concentration CCBi
- inc outgoing dye concentration Q - blood flor
rate VB - volume of blood in the organ.
3
Figure 6.3. (a) Concentration-time curve for
dye infusion X -time of injection at the
injection site Y - time of first arrival of the
dye at the sampling site A - rising part of the
dye concentration curve B - exponential decay
part of the curve C - beginning of recirculation
of the dye D - part of the curve if no
recirculation had occured. (b) a semilogarthmic
plot of the dye concentration curve where B'
portion of the curve yields a straight line
corresponding to the exponential decay of the
curve from 6(a). (Redrawn from Burton 1971
with permission from Mosby-Year Book Inc.).
4
Figure 6.4. Concentration-time curve data.
the rectangular areas represent the calculated
average concentration of dye in the arterial
blood for the duration in the respective curves.
(Redrawn from Guyton 1986, with permission from
the author and W. B. Saunders Co.).
5
Electro-Magnetic Flow Probe
Faradays law
(Volts)
l m, A m2
B weber/m2,
Pros ideal device for in vitro testing Cons -
invasive - contact of the electrode
with the arterial wall deterioration of
signal may occur. - Assumption flat
velocity profile (Not ideal for
circular cross-section axisym.)
6
Typical Extracorporeal EMF probes
Typical Intracorporeal EMF probes
7
A typical flow rate distal to a heart valve from
an EMF meter
8
pressure sensing element
A catheter-tipped pigtail pressure transducer
9
Comparison of pressure signals recorded with
fluid-filled catheter transducer and
catheter-tipped transducer. Note the similarity
of the signals between the two transducers in the
absence of air bubble in the catheter. Changes
in pulse shape and time delay are observed with
the presence of air bubble with the fluid-filled
catheter. (Redrawn from Geddes 1984, with
permission from John Wiley and Sons, New York).
10
Distorted pressure signals in a fluid-filled
catheter due to catheter whip (a) good quality
pressure recording and (b) the distorted signal
due to catheter whip.
11
A typical hot film probe (Courtesy of TSI Inc.,
St. paul, Minnesota)
12
A typical calibration curve with a hot film
sensor (Courtesy of TSI Inc., St. paul, Minnesota)
13
A typical velocity profile in the aortic vessel
of a horse measured with hot film anemometry
technique (Redrawn from Nerem et al., 1974,
with permission from the authors and Americal
Heart Association)
14
Schematic illustrating the Doppler principle.
(a) Stationary source 'A' is emitting ultrasound
waves and the observer ar 'B' detects those waves
with no change in frequency (b) the source is
moving away from the observer detects a frequency
different from the original frequency of the
source.
15
Schematic of blood velocity measurement with
Doppler transducers. The velocity of the boddl
cell, V, and hence that of blood is computed
using Equation 6.24.
16
Velocity profiles in the aorta of a dog using
ultrasound Doppler velocity measurement
techniques (a) 90 msec and (b) 320 msec after
the opening of the valve. 1A, 2B, and 3C
represent profiles in perpendicular planes
corresponding to the profiles shown in the plane
of the figure. (Redrawn from Farthing and
Peronneau, 1979 with permission)
17
Input impedance in the aorta of dog (A)and human
(B). (Redrawn from Milnor 1989 with permission
from the author and Williams and Wilkins,
Baltimore, Maryland).
18
Input impedance in the main pulmonary circulation
of a dog (Redrawn from Milnor 1989 with
permission from the author and Williams and
Wilkins, Baltimore, Maryland).


