Introduction to NCL The NCAR Command Language - PowerPoint PPT Presentation
Title:
Introduction to NCL The NCAR Command Language
Description:
Introduction to NCL The NCAR Command Language – PowerPoint PPT presentation
Number of Views:1799
Avg rating:3.0/5.0
Title: Introduction to NCL The NCAR Command Language
1
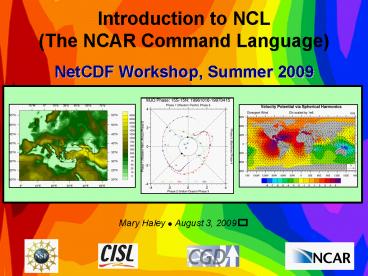
Introduction to NCL(The NCAR Command
Language) NetCDF Workshop, Summer 2009 Mary
Haley ? August 3, 2009
2
Thanks Ed!(and presenters/organizersof this
workshop)
3
NCLs team of software engineers and scientists
4
NCAR Command Language (NCL)A scripting language
tailored for theanalysis and visualization of
geoscientific data
- Simple, robust file input and output
- Hundreds of analysis functions
- Visualizations (2D) are publication quality and
highly customizable - UNIX binaries and source code available, free
- Extensive website, training
http//www.ncl.ucar.edu/
5
History Scope
- First released in 1995
- Visualizations based on NCAR Graphics
- CCSM post-processing competition 1996-1997
- Python interfaces (PyNGL/PyNIO) - early 2000s
- WRF-NCL collaboration - early 2000s
- VAPOR-NCL collaboration- last year
- First training workshop in 2000, 42 so far, 570
attendees - Currently
- 7126 registered users in 114 countries
- 911 on email list
- Average 200 email postings a month
- Average 1500 downloads a month
6
Overview of NCLs capabilities
- File input/output
- Data analysis
- Visualization
7
File input and output
- Data model based on netCDF variable model
(metadata describes data) - One function reads all supported data formats
- netCDF-3, netCDF-4 classic, GRIB 1 and 2, HDF4,
HDF-EOS2, shapefiles, CCM History tape (legacy)
(soon HDF-EOS5), HDF5? - Writes netCDF-3/-4 classic and HDF4
- OPeNDAP-enabled client available
- ASCII, binary (read and write)
- Python interface - PyNIO
http//www.ncl.ucar.edu/Applications/list_io.shtml
8
NCL Data Model
- NCL variables are based on the netCDF data model
a structure containing metadata - Metadata is information about a variable
- With netCDF files, metadata consists of
- Attributes
- Named dimensions
- Coordinate arrays
- The _FillValue attribute is a special one
indicating a variables missing value
9
Examining a netCDF file with NCL
f addfile(ANN_MEAN.nc, r) print(f)
Similar to netCDFs ncdump, but can use on
GRIB, HDF, HDF-EOS, shapefile Can also use
ncl_filedump on UNIX command line ncl_filedump
ANN_MEAN.nc
10
Reading a variable from a supported file, use -gt
f addfile(ANN_MEAN.nc, r) olr
f-gtOLR printVarSummary(olr) just print info
11
Writing a variable to a netCDF file, also use -gt
fout addfile(newfile.nc, c) Assume you
have an NCL variable t with potential
attributes, coordinate arrays. Write some
global file attributes fout_at_Conventions
None! fout_at_history Created on
system(date) Now write variable and all its
metadata It will be called T on the netCDF
file. fout-gtT t
12
NCL tools for files
- ncl_filedump like ncdump, hdump
ncl_filedump uv300.nc ncl_filedump
ruc.grb ncl_filedump -v lv_ISBL2
wafsgfs_L_t06z_intdsk60.grb2
http//www.ncl.ucar.edu/Document/Tools/
13
Data analysis
- Array-based math (no need to loop across
dimensions) - Hundreds (800) of functions
- Spherical harmonics
- Scalar and vector regridding
- Vertical interpolation
- EOFs
- Date/time conversions (UDUNITS)
- Many tailored to geosciences
- Most handle missing data
- Can call C and Fortran routines from NCL
http//www.ncl.ucar.edu/Document/Functions/
14
Visualization
- High-quality and customizable visualizations
- Contours, XY, vectors, streamlines
- Maps with common map projections
- Handles data on regular and irregular
grids,triangular meshes - Specialized scripts for MJO CLIVAR, skew-T,wind
roses, histograms, Taylor diagrams, panels, bar
charts - High-level interfaces simplifies visualization
- Over 1,400 visualization options
- PyNGL Python interface
http//www.ncl.ucar.edu/gallery.shtml
15
(No Transcript)
16
A Skew-T plot is used by meteorologists to
analyze data from a balloon sounding.
Courtesy of Dennis Shea
CCMVal Workshop 2009 ? June 1-5, 2009
17
Data from Climate Analysis Section Christian
Guillemot
18
CCMVal Workshop 2009 ? June 1-5, 2009
19
A T-S diagram is a graph showing the relationship
between temperature and salinity as observed
together at, for example, specified depths in a
water column. Isopleths of constant density are
often also drawn on the same diagram as a useful
additional interpretation aid. In the ocean,
certain T-S combinations are preferred, leading
to the procedure of identification via the
definition of water types and water masses and
their distributions.Image contributed by
Christine Shields,NCAR/CGD.
20
Courtesy Mark Stevens, NCAR CGD
21
Madden Julian Oscillation Climate Variability
Suite of MJO diagnostics scripts developed by
Dennis Shea, NCAR/CGD. Data, C-shell scripts,
fortran code provided by the US-CLIVAR MJO
working group
22
MJO graphic Courtesy of Dennis Shea/CGD
23
MJO graphic Courtesy of Dennis Shea/CGD
CCMVal Workshop 2009 ? June 1-5, 2009
24
CCMVal Workshop 2009 ? June 1-5, 2009
25
Image courtesy of Julie ArblasterBureau of
Meteorology, University of Melbourne
26
Image courtesy of Jeff Yin, CGD
27
A wind rose displays the frequency (percentage)
of wind directions for a specific location over a
specified period of time.
Dennis Shea, CGD
28
NCL image courtesy of Christine Shields,
CGD Paleogeography data courtesy David Rowley,
PGAP
29
Types of special grids that NCL and PyNGL can
contour
Coming soon vectors and streamlines on
non-uniform grids
30
Triangular mesh from Brett D. Estrada, Naval
Research Laboratory
31
Triangular mesh from Tom Gross NOAA/NOS/CSDL/MMAP
CCMVal Workshop 2009 ? June 1-5, 2009
32
Data from Dave Randall, Todd Ringler, Ross Heikes
of CSU
Contoured using Triangle code Jonathan
Shewchuk, Berkeley
Most geodesic grids appear to be formed by
elaborating an icosahedron each of the 20 faces
of the icosahedron is subdivided into smaller
triangles in a more or less obvious way.
33
Data from Dave Randall, Todd Ringler, Ross Heikes
of CSU
34
Adaptive grid - Christiane Jablonowski,
ECMWFConstructed using boundary lines which are
all either horizontal or vertical on a
cylindrical equidistant projection of the globe.
First, the rectangular area covered by the
projection is divided into smaller rectangles,
all of which are the same size. Some (but not
all) of these rectangles are subdivided into four
smaller rectangles of equal size, and some (but,
again, not all) of those are subdivided into even
smaller rectangles of equal size.
35
Adaptive grid Data from Christiane Jablonowski,
ECMWF
36
ARPEGE GRID (used by Meteo-France) Christophe
Cassou (CNRS/CERFACS)
Similar to ISCCP grid, but with somewhat finer
resolution. Grid is rotated with respect to the
globe so as to put its poles somewhere other than
at the North and South Pole.
37
Grid from Houjun WangNCAR University of
Maryland
38
This grid could be described as a tripole grid
that is further modified by the arbitrary
displacement of some portions of the grid to
achieve finer resolution over areas of interest
(typically, ocean areas).
Christophe Cassou (CNRS/CERFACS)
39
http//isccp.giss.nasa.gov/
40
(No Transcript)
41
Graphic byYi Wang, PNNL
42
Connectivity graphs from a biological neural
network model. Trevor Law, Univ of California _at_
Irvine
43
From John Ertl, FNMOC
CCMVal Workshop 2009 ? June 1-5, 2009
44
CCMVal Workshop 2009 ? June 1-5, 2009
45
Sample WRF-ARW visualizationsScripts maintained
by Cindy Bruyère, NCAR/MMM
46
New map outlines in V5.0.1
47
New and improved projections
48
Courtesy Mark Stevens NCAR/CGD
Climate divisions are built into NCL and PyNGL
CCMVal Workshop 2009 ? June 1-5, 2009
49
Evans plot - Created by Jason Evans of Yale
University. An Evans plot is a way to visualize
spatially, two variables of interest, one of
which provides some measure of "importance".
50
Ufuk Turuncoglu, ITU - Turkey Climate Change
Scenarios
51
Taylor diagram Courtesy of Dennis Shea and Adam
Phillips, CGD
52
Graphic by Jonathan Vigh, Colorado State
University
53
Based on a visualization of Adam Phillips
54
Image courtesy Rick Brownrigg VAPOR/NCL
55
Image courtesy Dave Brown POP Grid
56
John Fasullo, NCAR/CGD
57
Hundreds of application examples
http//www.ncl.ucar.edu/Applications/
58
(No Transcript)
59
(No Transcript)
60
(No Transcript)
61
create BandPass Filter
ihp 2
bpfgtband pass filter nWgt
201 sigma 1.0 Lanczos
sigma fca 1./100. fcb 1./20.
wgt filwgts_lanczos (nWgt, ihp, fca, fcb,
sigma )
Read daily U
anomalies
fili
"uwnd.day."plev".anomalies.1980-2005.nc f
addfile (dirifili , "r") TIME
f-gttime days since
... YMD ut_calendar(TIME, -2)
entire (time,6) iStrt ind(YMD.eq.ymdStrt)
index start iLast
ind(YMD.eq.ymdLast) index last
delete(TIME) delete(YMD ) x
f-gtU_anom(iStrtiLast,,) U_anom_sm
printVarSummary(x) printMinMax(x, True)
time f-gttime(iStrtiLast) days
since ..
62
NCL Training Workshops
- 7 workshops in 2008, 3 already in 2009
- University of Wisconsin-Madison (9/08)
- Max-Planck, Hamburg (12/08)
- SCRIPPS Institution of Oceanography (2/09)
- One more local NCL workshop in 2009
- One-day tutorial at CCMval workshop, June 2009
- Very short tutorial at TG09, June 2009
- Short tutorial at WRF Workshop, late June 2009
- Invite for two consecutive workshops in Europe
(German and Finnish Weather Services, Free
University/Berlin, ETH) - Free workshop to one UCAR member university a
year
http//www.ncl.ucar.edu/Training/Workshops/
63
Summary
- NCL is a robust tool and easy tool for reading
and writing geoscientific data (netCDF, HDF4,
HDF-EOS2, GRIB 1/2) - There are hundreds of specialized functions, most
automatically handle missing data - Graphics are world class and highly customizable
- Developed in close relationship with researchers
at NCAR - Free, open source, and available in precompiled
form for many UNIX systems - The website is extensive with hundreds of
downloadable examples - Not just about the software
- User consulting is quick and knowledgeable
- Developers listen closely to the user community
to drive future plans - Free training workshops available, tailored to
learning how to analyze your own data
64
Thank you! Questions?
http//www.ncl.ucar.edu/
haley_at_ucar.edu
Recommended
CrystalGraphics Presentations