
Time Dispersion - PowerPoint PPT Presentation
1 / 23
Title: Time Dispersion
1
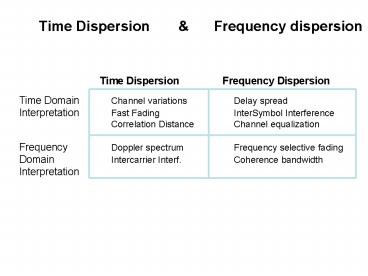
Time Dispersion Frequency dispersion
Time Dispersion Frequency Dispersion
2
Fading is characterised by two distinct mechanisms
- 1. Time dispersion
- Time variations of the channel are caused by
motion of the antenna - Channel changes every half a wavelength
- Moving antenna gives Doppler spread
- Fast fading requires short packet durations, thus
high bit rates - Time dispersion poses requirements on
synchronization and rate of convergence of
channel estimation - Interleaving may help to avoid burst errors
- 2. Frequency dispersion
- Delayed reflections cause intersymbol
interference - Channel Equalization may be needed.
- Frequency selective fading
- Multipath delay spreads require long symbol times
- Frequency diversity or spread spectrum may help
3
Time dispersion of narrowband signal (single
frequency)
Transmit cos(2p fc t) Receive I(t) cos(2p fc
t) Q(t) sin(2p fc t) R(t) cos(2p fc t f)
- I-Q phase trajectory
- As a function of time, I(t) and Q(t) follow a
random trajectory through the complex plane - Intuitive conclusion
- Deep amplitude fades coincide with large phase
rotations
4
Doppler shift
- All reflected waves arrive from a different
angle - All waves have a different Doppler shift
The Doppler shift of a particular wave is
Maximum Doppler shift fD fc v / c
- Joint Signal Model
- Infinite number of waves
- Uniform distribution of angle of arrival f
fF(f) 1/2p - First find distribution of angle of arrival the
compute distribution of Doppler shifts - Line spectrum goes into continuous spectrum
5
Doppler Spectrum
If one transmits a sinusoid, what are the
frequency components in the received signal?
- Power density spectrum versus received frequency
- Probability density of Doppler shift versus
received frequency - The Doppler spectrum has a characteristic
U-shape. - Note the similarity with sampling a
randomly-phased sinusoid - No components fall outside interval fc- fD,
fc fD - Components of fD or -fD appear relatively
often - Fades are not entirely memory-less
6
Derivation of Doppler Spectrum
7
Vertical Dipole
8
How do systems handle Doppler Spreads?
- Analog
- Carrier frequency is low enough to avoid problems
- GSM
- Channel bit rate well above Doppler spread
- TDMA during each bit / burst transmission the
channel is fairly constant. - Receiver training/updating during each
transmission burst - Feedback frequency correction
- DECT
- Intended to pedestrian use
- only small Doppler spreads are to be anticipated
for - Original DECT concept did not standardize an
equalizer - IS95
- Downlink Pilot signal for synchronization and
channel estimation - Uplink Continuous tracking of each signal
9
Autocorrelation of the signal
We now know the Doppler spectrum. But how fast
does the channel change?
- Wiener-Kinchine Theorem
- Power density spectrum of a random signal is the
Fourier Transform of its autocorrelation - Inverse Fourier Transform of Doppler spectrum
gives autocorrelation of I(t) and Q(t)
10
Derivation of Autocorrelation of IQ-components
11
For uniform angle of arrival
12
Relation between I and Q phase
13
Autocorrelation of amplitude R2 I2 Q2
14
How to handle fast multipath fading?
15
Frequency Dispersion
- Frequency dispersion is caused by the delay
spread of the channel - Frequency dispersion has no relation to the
velocity of the antenna
16
Frequency Dispersion Delay Profile
17
RMS Delay Spread and Maximum delay spread
18
Typical Delay Spreads
19
Typical Delay Profiles
20
How do systems handle delay spreads?
21
Frequency and Time Dispersion
22
Scatter Function of a Multipath Mobile Channel
Gives power as function of
f
Doppler Shift (derived from angle
)
Excess Delay
Example of a scatter plot
Horizontal axes
x-axis
Excess delay time
y-axis
Doppler shift
Vertical axis
z-axis
received power
23
Correlation of Fading vs. Frequency Separation
24
Inphase and Quadrature-Phase Components
25
(No Transcript)
26
Normalized Envelope Covariance
27
(No Transcript)
28
Coherence Bandwidth
Recommended
CrystalGraphics Presentations


