
Figure 14-1 Page 305 - PowerPoint PPT Presentation
1 / 36
Title:
Figure 14-1 Page 305
Description:
1 automobile. 1 kilogram. cotton. 1 kilogram. aluminum. 1 kilogram ... dependence. on coal. Reduces air. pollution. Reduces CO2. emissions. Reduces chances of ... – PowerPoint PPT presentation
Number of Views:45
Avg rating:3.0/5.0
Title: Figure 14-1 Page 305
1
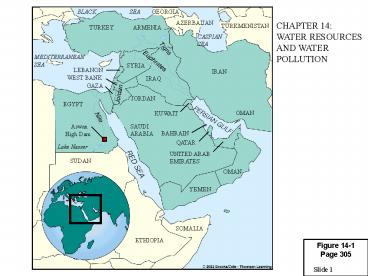
Figure 14-1Page 305
CHAPTER 14 WATER RESOURCES AND WATER POLLUTION
2
Figure 14-2Page 307
All water
Fresh water
Readily accessible fresh water
Groundwater 0.592
Biota 0.0001
Rivers 0.0001
Lakes 0.007
Lakes
0.014
Fresh water 2.6
Oceans and Saline lakes 97.4
Soil Moisture 0.005
Oceans and saline lakes 97.4
Ice caps and glaciers 1.984
Ice caps and glaciers 1.984
Atmospheric water vapor 0.001
Soil moisture 0.005
3
Figure 14-3Page 308
Flowing artesian well
Unconfined Aquifer Recharge Area
Precipitation
Evaporation and transpiration
Well requiring a pump
Evaporation
Confined Recharge Area
Runoff
Aquifer
Stream
Infiltration
Water table
Lake
Infiltration
Unconfined aquifer
Confined aquifer
Less permeable material such as clay
Confining permeable rock layer
4
Figure 14-4Page 309
Total use
Agricultural use
Industrial use
Domestic use
Year
5
Figure 14-5Page 309
United States
China
Agriculture 41
Agriculture 87
Power cooling 38
Public 6
Industry 7
Industry 11
Public 10
6
Figure 14-6Page 309
400,000 liters (106,000 gallons)
1 automobile
1 kilogram cotton
10,500 liters (2,400 gallons)
1 kilogram aluminum
9,000 liters (2,800 gallons)
1 kilogram grain-fed beef
7,000 liters (1,900 gallons)
1 kilogram rice
5,000 liters (1,300 gallons)
1 kilogram corn
1,500 liters (400 gallons)
1 kilogram paper
880 liters (230 gallons)
220 liters (60 gallons)
1 kilogram steel
7
Figure 14-7 (1)Page 310
Average annual precipitation (centimeters)
Less than 41
81-22
More than 122
41-81
8
Figure 14-7 (2)Page 310
Acute shortage
Shortage
Adequate supply
Metropolitan regions with population greater than
1 million
9
Figure 14-8Page 311
Europe
North America
Asia
Africa
South America
Australia
Stress
High
None
10
Figure 14-9Page 312
DAMS ARE A SOLUTION AND CREATE MANY ENVIRONMENTAL
PROBLEMS
Downstream cropland and estuaries are deprived
of nutrient-rich silt
Flooded land destroys forests or cropland
and displaces people
Large losses of water through evaporation
Downstream flooding is reduced
Provides water for year-round irrigation
of cropland
Reservoir is useful for recreation and fishing
Can produce cheap electricity (hydropower)
Migration and spawning of some fish are disrupted
11
Figure 14-10Page 312
ENVIRONMENTAL AND ECOLOGICAL SERVICES PROVIDED BY
FREE FLOWING RIVERS
Deliver nutrients to the sea sustain coastal
fisheries Deposit silt that maintains deltas
Purify water Renew and nourish wetlands
Provide habitats for aquatic life Conserve
species diversity
12
Figure 14-11Page 313
Chinas Three Gorges Dam
Advantages
Disadvantages
Generates 10 of Chinas electricity Reduces
dependence on coal Reduces air
pollution Reduces CO2 emissions Reduces
chances of downstream flooding for 15 million
people Reduces river silting below dam by
eroded soil Increases irrigation water for
cropland below dam
Floods large areas of cropland and
forests Displaces 1.9 million
people Increases water pollution because of
reduced water flow Reduces deposits of
nutrient-rich sediments below dam Increases
saltwater introduced into drinking water near
mouth of river because of decreased water
flow Disrupts spawning and migration of some
fish below dam High cost
13
Figure 14-12Page 313
OVERUSE HAS CAUSED THE FORMER ARAL SEA (LAKE) TO
BECOME A DRY, SALTY, BARREN LAND THAT SPREADS AIR
POLLUTION TO NEARBY FARMLAND. THE REMAINING
WATER IS BRINE
KAZAKHSTAN
2000
ARAL SEA
1989
1960
UZBEKISTAN
TURKMENISTAN
14
Figure 14-13Page 314
SOUTHERN CALIFORNIA TAKES WATER FROM NORTH CA.,
THE COLORADO RIVER AND GROUND WATER
CALIFORNIA
NEVADA
Shasta Lake
UTAH
Oroville Dam and Reservoir
Sacramento River
Feather River
Lake Tahoe
North Bay Aqueduct
Sacramento
San Francisco
Hoover Dam and Reservoir (Lake Mead)
Fresno
South Bay Aqueduct
Colorado River
Los Angeles Aqueduct
San Luis Dam and Reservoir
ARIZONA
California Aqueduct
Central Arizona Project
Colorado River Aqueduct
Santa Barbara
Los Angeles
Phoenix
Salton Sea
San Diego
Tucson
MEXICO
15
Figure 14-14Page 315
Withdrawing Groundwater
Advantages
Disadvantages
Good source of water for drinking and
irrigation Available year- round Exists almost
everywhere Renewable if not overpumped or
contaminated No evaporation losses Cheaper to
extract than most surface waters
Aquifer depletion from overpumping Sinking of
land (subsidence) when water removed Polluted
aquifers unusable for decades or
centuries Saltwater intrusion into drinking
water supplies near coastal areas Reduced
water flows into streams, lakes, estuaries, and
wetlands Increased cost, energy use, and
contamination from deeper wells
16
Figure 14-16Page 316
EXAMPLE OF SALT WATER INTRUSION
Major irrigation well
Well contaminated with saltwater
Water table
Sea Level
Salt water
Fresh groundwater aquifer
Interface
Interface
Saltwater Intrusion
Normal Interface
17
Figure 14-17Page 316
Groundwater Depletion
Prevention
Control
Waste less water Subsidize water
conservation Ban new wells in aquifers near
surface waters Buy and retire groundwater
withdrawal rights in critical areas Do not
grow water- intensive crops in dry areas Reduce
birth rates
Raise price of water to discourage
waste Tax water pumped from wells near
surface waters Set and enforce minimum
stream flow levels
18
Figure 14-18Page 317
WYOMING
SOUTH DAKOTA
Less than 61 meters (200 ft)
61-183 meters (200-600 ft)
More than 183 meters (600 ft) (as much as 370
meters or 1,200 ft. in places)
NEBRASKA
OGALLALA AQUIFER SUPPLIES MUCH OF THE CENTRAL
U.S. WITH WATER FOR AGRICULTURE
KANSAS
COLORADO
OKLAHOMA
NEW MEXICO
TEXAS
Miles
0
100
0
160
Kilometers
19
Figure 14-19Page 319
Gravity Flow (efficiency 60 and 80 with surge
valves) Water usually comes from an aqueduct
system or a nearby river.
Drip Irrigation (efficiency 90-95) Above- or
below-ground pipes or tubes deliver water to
individual plant roots.
Center Pivot (efficiency 80 with low-pressure
sprinkler and 9095 with LEPA
sprinkler) Water usually pumped from
underground and sprayed from mobile boom with
sprinklers.
IRRIGATION EFFICIENCY CAN BE IMPROVED TREMENDOUSLY
20
Figure 14-20Page 319
WAYS TO IMPROVE IRRIGATION. MANY OF THE SUPERIOR
WAYS OF IRRIGATING CROPS REQUIRE A LARGE INITIAL
CAPITAL OUTLAY PREVENTING SMALL FARMERS AND
DEVELOPING COUNTRIES FROM USING THEM.
- Lining canals bringing water to irrigation
ditches - Leveling fields with lasers
- Irrigating at night to reduce evaporation
- Using soil and satellite sensors and computer
systems to monitor soil moisture and add water
only when necessary - Polyculture
- Organic farming
- Growing water-efficient crops using
drought-resistant and salt-tolerant crop
varieties - Irrigating with treated urban waste water
- Importing water-intensive crops and meat
21
Redesign manufacturing processes Landscape
yards with plants that require little water
Use drip irrigation Fix water leaks Use
water meters and charge for all municipal water
use Raise water prices Require water
conservation in water-short cities Use
water-saving toilets, showerheads, and front-
loading clothes washers Collect and reuse
household water to irrigate lawns and
nonedible plants Purify and reuse water for
houses, apartments, and office buildings
WE SAW XERISCAPING AND RAINFALL CATCHMENTS ON OUR
FIELD TRIP TO CARKEEK PARK
22
Figure 14-23Page 322
NATURAL FLOODPLAINS ARE GOOD FARMLAND DUE TO THE
ANNUAL INCREMENT OF SILT PROVIDED BY THE FLOOD
WATER. TO PREVENT FLOODS LEVEES ARE BUILT AND
THE RIVERS AND STRAIGHTENED, CHANNELIZED AND
DAMMED. THIS ENCOURAGES PEOPLE TO MOVE ONTO
FLOODPLAINS BUT THEN FLOODS RETURN IN EVEN LARGER
PROPORTIONS WHEN HEAVY RAINS OVERWHELM THE
SYSTEMS AND INCREASES FROM URBAN DEVELOPMENT
RUNOFF OCCUR. MANY FLOOD PROBLEMS ARE SIMPLY
TRANSFERRED DOWNSTREAM.
Reservoir
Dam
Levee
Flood wall
Floodplain
23
Figure 14-24 (1)Page 322
FORESTS PROVIDE NATURAL FLOOD CONTROL AND
MODERATE THE CLIMATE
Oxygen released by vegetation
Diverse ecological habitat
Evapotranspiration
Trees reduce soil erosion from heavy rain and wind
Agricultural land
Steady river flow
Leaf litter improves soil fertility
Tree roots stabilize soil and aid water flow
Vegetation releases water slowly and reduces
flooding
Forested Hillside
24
Figure 14-24 (2)Page 322
DEFORESTATION RESULTS IN MANY PROBLEMS AND IN THE
PNW THESE INCLUDE THE DESTRUCTION OF SALMON
HABITAT
Tree plantation
Evapotranspiration decreases
Roads destabilize hillsides
Ranching accelerates soil erosion by water and
wind
Winds remove fragile topsoil
Agriculture land is flooded and silted up
Gullies and landslides
Heavy rain leaches nutrients from soil and erodes
topsoil
Rapid runoff causes flooding
Silt from erosion blocks rivers and reservoirs
and causes flooding downstream
After Deforestation
25
Figure 14-26Page 325
POINT AND NONPOINT SOURCES OF WATER POLLUTION. IT
IS EASIER TO IDENTIFY, CONTROL AND PAY FOR
SOLVING POINT SOURCE PROBLEMS COMPARED TO
NONPOINT POLLUTION SOURCES
26
Figure 14-27Page 326
Normal clean water organisms (Trout, perch,
bass, mayfly, stonefly)
Trash fish (carp, gar, leeches)
Fish absent, fungi, sludge worms, bacteria (anaero
bic)
Trash fish (carp, gar, leeches)
Normal clean water organisms (Trout, perch,
bass, mayfly, stonefly)
8 ppm
Types of organisms
Dissolved oxygen (ppm)
8 ppm
Biological oxygen demand
Clean Zone
Recovery Zone
Septic Zone
Decomposition Zone
Clean Zone
POLLUTION OF FRESHWATER STREAMS, LAKES AND
GROUNDWATER. POINT SOURCE STREAM POLLUTION OFTEN
CAUSES AN OXYGEN SAG IN STREAMS. DUE TO
STRATIFICATION AND LESS FLOW LAKES ARE MORE
EASILY POLLUTED THAN STREAMS AND RIVERS
27
Stepped ArtFigure 14-28Page 328
ANOTHER EXAMPLE OF BIOMAGNIFICATION AND
BIOACCUMULATION
28
Figure 14-29Page 329
Discharge of untreated municipal
sewage (nitrates and phosphates)
Discharge of detergents (phosphates)
Natural runoff (nitrates and phosphates)
Inorganic fertilizer runoff (nitrates and
phosphates)
Manure runoff from feedlots (nitrates,
phosphates, ammonia)
Discharge of treated municipal sewage (primary
and secondary treatment nitrates and
phosphates)
Runoff from streets, lawns, and construction
lots (nitrates and phosphates)
Lake ecosystem nutrient overload and breakdown of
chemical cycling
Dissolving of nitrogen oxides (from internal
combustion engines and furnaces)
Runoff and erosion (from cultivation, mining,
construction, and poor land use
CAUSES OF CULTURAL EUTROPHICATION
29
Figure 14-30Page 330
CANADA
Nipigon Bay
Jackfish Bay
Thunder Bay
Silver Bay
St. Marys R.
St. Lawrence R.
Spanish R.
St. Louis R.
MICHIGAN
Penetary Bay
WISCONSIN
Sturgeon Bay
MICHIGAN
Saginaw Bay
NEW YORK
Niagara Falls
Saginaw R. System
Grand R.
MINNESOTA
Niagara R.
St. Clair R.
Thames R.
Buffalo R.
Detroit R. Rouge R. Raisin R.
Ashtabula R.
PENNSYLVANIA
IOWA
Cuyahoga R.
Maumee R.
Rocky R.
Black R.
ILLINOIS
INDIANA
OHIO
Great Lakes drainage basin
Most polluted areas, according to the Great Lakes
Water Quality Board
Hot spots of toxic concentrations in water and
sediments
Eutrophic areas
THE GREAT LAKES HAVE A SORDID HISTORY OF
POLLUTION AND A POSITIVE RECORD OF THE POLITICAL
PROCESS WORKING TO CLEAN THEM. WHY IS SUPERIOR
THE CLEANEST AND ERIE THE MOST POLLUTED?
30
Figure 14-31Page 331
CAUSES OF GROUNDWATER POLLUTION
Hazardous waste injection well
Pesticides
De-icing road salt
Coal strip mine runoff
Buried gasoline and solvent tank
Cesspool septic tank
Pumping well
Gasoline station
Water pumping well
Waste lagoon
Sewer
Landfill
Leakage from faulty casing
Accidental spills
Discharge
Unconfined freshwater aquifer
Confined aquifer
Confined freshwater aquifer
Groundwater flow
31
Figure 14-33Page 334
Industry Nitrogen oxides from autos and
smokestacks toxic chemicals, and heavy metals in
effluents flow into bays and estuaries.
Cities Toxic metals and oil from streets
and parking lots pollute waters sewage adds
nitrogen and phosphorus.
Urban sprawl Bacteria and viruses from sewers and
septic tanks contaminate shellfish beds and
close beaches runoff of fertilization from lawns
adds nitrogen and phosphorus.
Construction sites Sediments are washed into
waterways, choking fish and plants,
clouding waters, and blocking sunlight.
Farms Run off of pesticides, manure,
and fertilizers adds toxins and excess nitrogen
and phosphorus.
Red tides Excess nitrogen causes explosive growth
of toxic microscopic algae, poisoning fish and
marine mammals.
Closed shellfish beds
Closed beach
Oxygen-depleted zone
Toxic sediments Chemicals and toxic
metals contaminate shellfish beds, kill spawning
fish, and accumulate in the tissues of bottom
feeders.
Healthy zone Clear, oxygen-rich waters promote
growth of plankton and sea grasses, and support
fish.
Oxygen-depleted zone Sedimentation and
algae overgrowth reduce sunlight, kill beneficial
sea grasses, use up oxygen, and degrade habitat.
CAUSES OF POLLUTION OF COASTAL WATERS AND BAYS
FROM DEVELOPMENT (RESIDENTIAL AREAS, FACTORIES
AND FARMS
32
Figure 14-34Page 335
Mississippi River Basin
Ohio River
Missouri River
Mississippi River
DEPLETED OXYGEN (2 PPM) DUE TO NITRATE AND
PHOSPHATEINPUT
LOUISIANA
Mississippi River
Depleted
Oxygen
Gulf of Mexico
33
Figure 14-35Page 335
Cooperstown
NEW YORK
CHESAPEAKE BAY IS A DEGRADED ECOSYSTEM
PENNSYLVANIA
ATLANTIC OCEAN
Harrisburg
NEW JERSEY
MARYLAND
Baltimore
Washington
WEST VIRGINIA
DELAWARE
Richmond
VIRGINIA
Chesapeake Bay
Norfolk
Drainage basin
No oxygen
Low concentrations of oxygen
34
Figure 14-36Page 337
Prevention Reduce input of toxic
pollutants Separate sewage and storm lines Ban
ocean dumping of sludge and hazardous dredged
material Protect sensitive areas from
development, oil drilling, and oil
shipping Regulate coastal development Recycle
used oil Require double hulls for oil tankers
Cleanup Improve oil-spill cleanup
capabilities Require at least secondary
treatment of coastal sewage or use wetlands,
solar-aquatic, or other sewage treatment
methods Require improved air pollution cleanup
to reduce input from the atmosphere
WAYS TO DEAL WITH COASTAL WATER POLLUTION
35
Figure 14-37Page 339
SEPTIC TANKS TO BE INSTALLED PROPERLY IN SOILS
WITH ADEQUATE DRAINAGE, NOT TOO CLOSE TOGETHER OR
TOO NEAR WELL SITES AND PUMPED OUT WHEN THE
SETTLING TANK BECOMES FULL
36
Figure 14-38Page 340
Secondary
Primary
Grit chamber
Chlorine disinfection tank
Bar screen
Settling tank
Aeration tank
Settling tank
To river, lake, or ocean
Raw sewage from sewers
(kills bacteria)
Sludge
Activated sludge
Air pump
Sludge digester
Sludge drying bed
Disposed of in landfill or ocean or applied to
cropland, pasture, or rangeland
TREATMENT OF MUNICIPAL SEWAGE
Recommended
CrystalGraphics Presentations


