
Viking Pump Flow Manager - Phase 2 - PowerPoint PPT Presentation
1 / 35
Title:
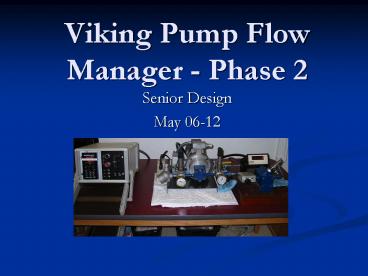
Viking Pump Flow Manager - Phase 2
Description:
Viking Pump Flow Manager - Phase 2 Senior Design May 06-12 People Team Members Dwayne Stammer - CprE Francois Munyakazi EE Dan Paulsen CprE/EE Faculty Advisor ... – PowerPoint PPT presentation
Number of Views:174
Avg rating:3.0/5.0
Title: Viking Pump Flow Manager - Phase 2
1
Viking Pump Flow Manager - Phase 2
- Senior Design
- May 06-12
2
People
- Team Members
- Dwayne Stammer - CprE
- Francois Munyakazi EE
- Dan Paulsen CprE/EE
- Faculty Advisor
- Nicola Elia
- Client Info
- Viking Pump Inc.
3
Outline
- Introduction and problem statement Dan Paulsen
- Design and implantation Dwayne Stammer
- Schedule, financial, and closing Francois
Munyakazi - Future Work Team
4
Definitions
- Flow meter An instrument used to measure
pressure, flow rate, and discharge rate of a
liquid, vapor, or gas flowing in a pipe - Set point The speed that a pump has to rotate in
order to achieve a given flow or output pressure - Viscous Having a relatively high resistance to
flow - QVGA 4x6 inch high resolution touch screen, has
onboard analog voltage inputs and outputs
5
Problem Statement
- Design a system to do the following
- Control a pump to maintain a given flow using
only speed, pressure, and temperature
measurements - Provide an easier user interface to control flow
rate and other working parameters - Provide access to system through serial bus
6
Why?
- Why is this valuable?
- Measuring flow for viscous fluids is very hard
- Less parts needed to build a pumping system
- Has many other uses such as batch flow, and error
detection - Inline meters to measure flow can hinder flow
performance - Problems with current system
- Hardware out of date
- User interface is outdated and difficult to use
7
System Use
- System will be configured and run by trained
technicians - Will operate in harsh factory floor
environments - Temperatures ranging from 40 to 120F
- Long periods of use
8
Assumptions
- Inputs from the system will be
- Inlet pressure input voltage
- Outlet pressure input voltage
- Temperature of the fluid input voltage
- Current pump speed input voltage pulse -
60 pulses/revolution - Outputs to the system will be
- 4-20mA signal to DC Drive
9
Limitations
- The controller must be able to operate in a real
time environment - The software implementation must be portable
- The controller solution must be economical
- The controller must be able to control the actual
flow within 0.25 of the set point
10
End Product
- Implementation for basic prototype that properly
controls pump system - Documentation of controller and source code
11
Problem Definition
- Current flow manager is difficult to use and
obsolete - User interface needs updated to a much more
intuitive interface - Will be solved using a new touch screen interface
- Hardware used is no longer available because it
was custom made to the application - Will be solved using over the shelf parts
- Writing software with different hardware
platforms in mind
12
System Overview
Revolution Counter
Motor
Flow Meter Readout
Pressure Gauges
Flow
Thermometer
Pressure Readouts
Flow meter
Pump
Pressure Relief Valve
13
System Overview
- Four inputs
- Inlet pressure
- Output pressure
- Fluid Temperature (to determine viscosity)
- Pump RPM
- One output
- Desired motor speed
14
Previous Model
- Outdated User Interface
The current Flow Manager provides the user with a
less-than-intuitive interface. Certain
combinations of button presses will change its
operational state. Our primary goal is to
develop a user interface that is easier to use
and incorporates all warning lights into the
touch screen.
15
Previous Model
16
Updated Model
- Touch screen user interface
- Updated C code
- Standardized equipment (not as much customized
circuitry required) - PC interface with more advanced GUI features
17
Updated Model
- Standardized equipment
The QVGA controller card provides touch screen
capabilities delivered through a C library. It
also supports digital and analog I/O. This
eliminates the need for fully customized
circuits, thus reducing production cost.
18
Updated Model
- PC interface
19
Updated Interface Circuitry
20
Updated Graphical Interface
21
Initial Performance Measurement
Violet Output Signal
Red Flow Rate
22
Updated Flow Manager
23
Algorithm Performance
Blue Set Point
Green Flow Rate
Orange Pressure
24
Schedule
25
Personal Effort
Total hours 839
26
Project Costs
- QVGA Repair 250 Provided by Senior Design
- Pump equipment 0 Donated by Viking
- Miscellaneous parts 175 Viking/Group members
- Poster 40 Group members
- Total material cost 465
- Total material cost
- Labor (839hrs _at_ 11.00)
9,229.00 - Materials 465.00
- Total cost of project
9,694.00 - 7,525.50 Previous group
- Project Total thus far 17,219.50
27
What Went Well
- Some part were easy to get from common store
- Design of project was easy, important decisions
already made by previous team - Communication between components was fairly well
- Good Coordination between team members
28
What Didnt Go Well
- Understanding the definition of the project
- Learning how to interface with the pump
- QVGA was damaged because we did not understand
how the pieces should work together. - Dealt with odd behavior with parts which were out
of the scope of our project. - Communication with sensors and QVGA
29
Knowledge Gained
- Learned the control algorithms for pump flows
- Learned How to program the QVGA
- Developed team communication
- Learned how to effectively distribute work loads
among team members - Learned how to better work with clients while
keeping a project on track
30
Risk Management
- Anticipated risks
- Loss of code
- Loss of team member
- Anticipated risks encountered
- Loss of team member
- John Taylor went to internship
- Cliff Pinsent graduated
- Unanticipated risks encountered
- Damage of the QVGA
31
Work Completed
- Repair QVGA
- Acquired model from Viking
- Studied algorithm and controllers
- Designed and prototyped GUI screens
- Detected I/O of QVGA
- Wrote C code and serial code
- Build pump interface between QVGA and pump
- Designed circuitry for sensor testing and QVGA
32
Work Completed Cont.
- 80 Completed writing / debugging the C code to
control flow - 80 write and implement the full GUI
- Created a methodology for the QVGA to be
controlled via serial comm.
33
Closing
- The previous version of the product
- Pros Has a very large success
- Cons User interface
- The lack of user friendliness of the device even
thought it is still the best device on the market
34
Closing Cont.
- Viking Pumps needs a well-designed flow control
manager - To be used with already existing pumps.
- Cost effective
- Portability
- Moving from one hardware to another without major
software rework
35
Questions?
Recommended
CrystalGraphics Presentations


