
Statistics Mean Median PowerPoint PPT Presentations
All Time
Recommended

Statistics is a vast field. In this infographic we have given a detailed overview on statistics and it’s related concepts.
| PowerPoint PPT presentation | free to download

This presentation educates you about R used in Mean, Median and Mode. For more topics stay tuned with Learnbay.
| PowerPoint PPT presentation | free to download

Mean, Median, Mode and Range The Basics of Statistics Did You Know That you probably use Statistics such as Mean, Median, Mode and Range almost every day without ...
| PowerPoint PPT presentation | free to download

Mean, Median, and Mode. In everyday life it is often important to collect data. ... To find the mean, add all the data values together and divide by the number ...
| PowerPoint PPT presentation | free to view

Mean, Median, Mode & Range Find the mode of the following grades The mode is the number which occurs most often. The number which occurs most often is 93 The mode is ...
| PowerPoint PPT presentation | free to download

Statistics 202: Statistical Aspects of Data Mining Professor David Mease Tuesday, Thursday 9:00-10:15 AM Terman 156 Lecture 6 = More of chapter 3
| PowerPoint PPT presentation | free to download
You should have a pencil, a piece of paper, and a calculator if you need one. ... Sure, the words 'Mean, Median, Mode and Range' all sound confusing...
| PowerPoint PPT presentation | free to view

Statistics 202: Statistical Aspects of Data Mining Professor David Mease Tuesday, Thursday 9:00-10:15 AM Terman 156 Lecture 7 = Finish chapter 3 and start chapter 6
| PowerPoint PPT presentation | free to download

Title: Statistics and Statistical Process Control Subject: POE - Unit 6 - Lesson 6.4 - Quality Assurance Author: Paul Kane Keywords: statistics, statistical, process ...
| PowerPoint PPT presentation | free to download

Use a calculator to help you find the mean, median, mode, and range of the ... Using a deck of number playing cards (A-10 divide evenly), find the mean, median, ...
| PowerPoint PPT presentation | free to view

Mean, Median, and Mode. In everyday life it is often important to collect data. ... So, the mode is 68! Let's look at one more ... Find the mode for this set of data. ...
| PowerPoint PPT presentation | free to view
Statistics 1: Introduction to Probability and Statistics Section 3-2 Chapter 3 Describing data Exploring data Comparing data Descriptive Statistics Distribution ...
| PowerPoint PPT presentation | free to download
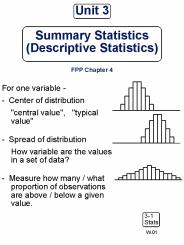
Unit 3 Summary Statistics (Descriptive Statistics) FPP Chapter 4 For one variable - - Center of distribution
| PowerPoint PPT presentation | free to download
Your book classifies only the mean and median as measures of location but not percentiles ... R and Excel give the same values. 41. 41. Measures of Association: ...
| PowerPoint PPT presentation | free to download

... in advanced math in eighth grade predict twelfth-grade math achievement scores? ... Download a free, 30-day trial of SPSS Statistics 17.0 at: http://www. ...
| PowerPoint PPT presentation | free to view

Creator: Mary Anne Burton ... Create a realistic story to represent the data. Examples: Number of TV. Money. Time ... How well does the mean represent the new data? ...
| PowerPoint PPT presentation | free to view

Do Now: Find the mean, median, mode, and range of the data. 1.) 14, 17, 18, 19, 20, 24, 24, 30, 32 FIND MEASURES OF CENTRAL TENDENCIES AND DISPERSION Academy Algebra ...
| PowerPoint PPT presentation | free to download

Excel function: =average(range) Median. Robust measure of central tendency ... VAR(range) Standard Deviation =STDEV(range) Comparing Standard Deviations. Mean = 15.5 ...
| PowerPoint PPT presentation | free to view

Does the calculation produce the mean of the original data? The Median ... Variance = Symbols for Population Parameters. Mean = Standard Deviation = Variance ...
| PowerPoint PPT presentation | free to view

... values in data set, there is only one middle value. This is the median. ... Q3 Who is your favourite Telly-Tubby survey. Construct Pie charts questions. 3. 7. 5 ...
| PowerPoint PPT presentation | free to view

Improving Quality in the Office for National Statistics' Annual Earnings Statistics ... The ASHE output focusses on medians and includes ten other percentiles outputs ...
| PowerPoint PPT presentation | free to view

Crosstabs with 2 variables creates a two-way table or crosstabulation. ... Two types of tests for comparing means: a priori contrasts and post hoc tests. ...
| PowerPoint PPT presentation | free to download

Find Mary's mean grade if she received grades of 86, 88, and 96 on her statistics exams. ... the median and midrange of Mary's grades. Sec. 13.5 The Four ...
| PowerPoint PPT presentation | free to view

Statistics Sample: Descriptive Statistics Population: Inferential Statistics Descriptive Statistics Measures of central tendency Mean Median Mode Measures of ...
| PowerPoint PPT presentation | free to download

Basic Statistics
- Basic Statistics Measures of Central Tendency Positively Skewed Distribution Mode
Basic Statistics Measures of Central Tendency Positively Skewed Distribution Mode
| PowerPoint PPT presentation | free to view
Review of Basic Statistics Descriptive Statistics Review Mean Sample Mean Example: College Class Size Population Mean ( ) Median The College Class Size example Median ...
| PowerPoint PPT presentation | free to download

Statistics Outline Types of Error A. Systematic vs. random II. Statistics A. Ways to describe a population 1. Distribution 2. Mean, median, mode 3. Standard deviation
| PowerPoint PPT presentation | free to download

Statistics Level F www.mathsrevision.com Mean Mean from a Frequency Table Median and Mode Range of a Set of Data Grouped Frequency Table * Created by Mr. Lafferty
| PowerPoint PPT presentation | free to view

Means & Medians Chapter 4 Parameter - Fixed value about a population Typical unknown Suppose we want to know the MEAN length of fish in Lake Lewisville . . .
| PowerPoint PPT presentation | free to view

mean , median , mode
| PowerPoint PPT presentation | free to view

Means & Medians Chapter 5 Parameter - Fixed value about a population Typical unknown Statistic - Value calculated from a sample Measures of Central Tendency Median ...
| PowerPoint PPT presentation | free to view

Introduction to Statistics Lecture 3 Covered so far Lecture 1: Terminology, distributions, mean/median/mode, dispersion range/SD/variance, box plots and outliers ...
| PowerPoint PPT presentation | free to view

Quahog School: 8, 6, 5, 4, 6, 5, 7, 10, 10, 7, 8, 9, 7 ... Quahog: Mean = 7.08 Median = 7.00. Springfield: Mean = 4.92 Median = 4.00 ...
| PowerPoint PPT presentation | free to download

Statistics Math 314
| PowerPoint PPT presentation | free to download

Statistics Achim Tresch Gene Center LMU Munich *
| PowerPoint PPT presentation | free to view
Statistics & Flood Frequency Chapter 3 Dr. Philip B. Bedient Rice University 2006 Flood Frequency Analysis Statistical Methods to evaluate probability exceeding a ...
| PowerPoint PPT presentation | free to download

Statistics Recording the results from our studies. Must use a common language so we all know what we are talking about. Inferential Statistics Determine whether ...
| PowerPoint PPT presentation | free to view
Population: Inferential Statistics. Descriptive Statistics. Measures of central tendency ... Relationship of sample mean to population mean example: number of pets ...
| PowerPoint PPT presentation | free to download

The higher the variance or SD, the more spread out the distribution is. Do scientists want a big or small SD? Dwayne Wade and Kobe may both score 26 ppg (same mean).
| PowerPoint PPT presentation | free to view
Descriptive statistics for one variable Measures of central tendency Mode (Mo): the most frequent score in a distribution good for nominal data Median ...
| PowerPoint PPT presentation | free to download
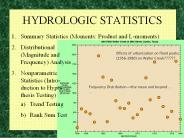
Quantile Functions. Statistical Expectation. Quantiles. median, quartiles, ... 'approx. quantile unbiased' Weibull plotting-positions (a=0) F(x) = i/(n 1) ...
| PowerPoint PPT presentation | free to download

Statistics Stem and Leaf Diagrams A 10 Question Warm Up Find the median of the following numbers:- 1) 3, 5, 6 2) 2, 4, 1, 9, 10 3) 9, 5, 12, 15, 21, 35, 2 Find ...
| PowerPoint PPT presentation | free to download

Inferential statistics are tools that indicate how much confidence we can have ... of that variable (Party Affiliation: Democrat-1; Republican-2; Independent-3) ...
| PowerPoint PPT presentation | free to download

Today I will demonstrate how to find the mean, median, and mode of a set of numbers. ... Find the median of the following numbers ...
| PowerPoint PPT presentation | free to view
Statistics Tests of Hypotheses for a Single Sample Contents, figures, and exercises come from the textbook: Applied Statistics and Probability for Engineers, 5th ...
| PowerPoint PPT presentation | free to download

STATISTICS. Clinical Research Unit. Seminar Series. Department ... Is DRUG A better than DRUG B? Is DISEASE Y associated ... Persons on treatment B had 74 ...
| PowerPoint PPT presentation | free to view

statistics exercise educational research
| PowerPoint PPT presentation | free to view

'If I had only one day left to live, I would live it in my statistics class the ... Pembroke. St Hilda's. 4.00-6.00pm. 2.00-4.00pm. How the course works ...
| PowerPoint PPT presentation | free to view

Descriptive Statistics Elementary Statistics Larson Farber Chapter 2
| PowerPoint PPT presentation | free to download

The formula for finding. the mean is: Mean = x. n. The Median ... We use the midpoint of the group and multiply this by the frequency. (fx) = 265. n = 30 ...
| PowerPoint PPT presentation | free to view

Statistics Tests of Hypotheses for a Single Sample Contents, figures, and exercises come from the textbook: Applied Statistics and Probability for Engineers, 5th ...
| PowerPoint PPT presentation | free to download
Basic Statistical Terms: Statistics: refers to the sample A means by which a set of data may be described and interpreted in a meaningful way.
| PowerPoint PPT presentation | free to download

Descriptive statistics Describing data with numbers: measures of location What to describe? What is the location or center of the data?
| PowerPoint PPT presentation | free to download

Title: Practical Statistics Author: College of Business Last modified by: Dennis E Clayson Created Date: 6/1/2006 5:48:38 PM Document presentation format
| PowerPoint PPT presentation | free to view

Median - the middle of the data; 50th percentile. Observations must ... S is the capital Greek letter sigma it means to sum the values that follow. parameter ...
| PowerPoint PPT presentation | free to view

Basic Statistics in Technology and Assessment Levels of Measurement Ordinal Level Interval Level Nominal Level Ratio Level Levels of Measurement (cont.) Nominal Level ...
| PowerPoint PPT presentation | free to view