Basic - PowerPoint PPT Presentation
1 / 18
Title:
Basic
Description:
This hydrometer reading is 1.000. Laboratory Analysis. Particle-Size Distribution (continued) ... the specific gravity and the hydrometer reading increase. ... – PowerPoint PPT presentation
Number of Views:75
Avg rating:3.0/5.0
Title: Basic
1
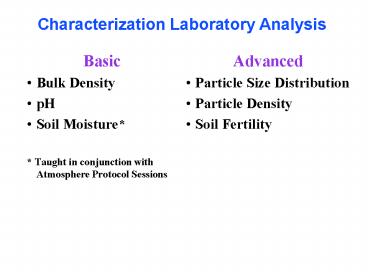
Characterization Laboratory Analysis
- Basic
- Bulk Density
- pH
- Soil Moisture
- Taught in conjunction with Atmosphere Protocol
Sessions
- Advanced
- Particle Size Distribution
- Particle Density
- Soil Fertility
2
Laboratory Analysis
Particle Size Distribution
Relative Size Comparison of Soil Particles
3
Laboratory Analysis
Particle-Size Distribution (continued)
Clay left in Suspension
Settled Silt
Settled Sand
Soil Mineral Particles Settled in Cylinder
Remember Stokes Law The bigger they are, the
faster they fall (in water)!
4
Laboratory Analysis
Particle-Size Distribution (continued)
Specific Gravity The weight of a substance
relative to the weight of an equal volume of
water.
This hydrometer reading is 1.000
5
Laboratory Analysis
Particle-Size Distribution (continued)
When soil is added to water, the specific gravity
and the hydrometer reading increase.
This hydrometer reading is 1.008
6
Laboratory Analysis
Particle-Size Distribution (continued)
- 25g soil
- 100mL Dispersing Solution
- 50mL Distilled H2O
- Put all three into a 500mL beaker and stir for
one minute. - Cover with plastic wrap and let mixture sit for
24 hours. - Remove plastic wrap and stir for one minute.
- Measure the distance from base of 500mL cylinder
(0mL line) to 500mL line. - Pour entire soil mixture into 500mL cylinder.
- Fill to 475mL line with distilled H2O and add to
500mL line with distilled H2O from squirt bottle. - Cover cylinder with plastic wrap.
7
Laboratory Analysis
Particle-Size Distribution (continued)
- Shake Cylinder hand over hand 10 times.
- Start timing. (e.g. timing starts at 1005 am)
From when you start timing
Time Action 1 min. 30 sec. Put Hydrometer in
cylinder. 2 min. Read hydrometer (remove, rinse
and dry hydrometer). 2 min. 30 secs. Put
thermometer in cylinder. 3 min. 30 secs. Take
temperature reading (take out, clean and dry
thermometer). 11 min. 30 sec. Put Hydrometer in
cylinder. 12 min. Read hydrometer (remove,
rinse and dry hydrometer). 12 min. 30 secs. Put
thermometer in cylinder. 13 min. 30 secs. Take
temperature reading (take out, clean and dry
thermometer).
Sample Time (1006 30 secs.) (1007) (1007 30
secs.) (1008 30 secs.) (1016 30
secs.) (1017) (1017 30 secs.) (1018 30 secs.)
8
Laboratory Analysis
Particle-Size Distribution (continued)
- Use the Particle Size Distribution protocol
worksheet to calculate the percent sand, silt,
and clay in your sample - Use the Textural Triangle do determine the soil
texture class and compare it to the texture you
determined by the field method.
Read the percentages on the triangle in the
direction that the numbers face. This soil is a
sandy clay loam
9
(No Transcript)
10
Comparison of Bulk Density and Particle Density
11
In the soil, air and water are found within the
pore spaces between the particles. If this ideal
soil were dried out, and all the pore space were
compressed so that there was no more air and no
more space, all that would remain would be the
solid portion of the soil.
To calculate bulk density, we would measure the
mass of the total volume of a soil sample.
12
Laboratory Analysis Particle Density
- Weigh out 25g soil and pour distilled water into
a squirt bottle.
- Weigh empty flask without the cap.
- Place 25g of soil into flask (wipe outside of
flask clean) and get their mass without the cap.
13
Laboratory Analysis Particle Density (continued)
- Using squirt bottle, add approximately 50mL
Distilled water into the flask. (Wash any soil on
the neck back into the bottom of the flask.)
- Bring soil and water mixture to a gentle boil for
10 minutes. During this time, agitate the flask
for 10 seconds every minute.
14
Laboratory Analysis Particle Density (continued)
- After 10 minutes, remove flask from heat and
allow it to cool. Cap flask and let sit for 24
hours. Cap flask and let sit for 24 hours.
- At 24 hours, remove cap and add enough Distilled
H2O to bring volume to 100mL (the bottom of the
meniscus should be at 100mL).
15
Laboratory Analysis Particle Density (continued)
- Weigh the soil and water mixture without the cap.
- Take temperature reading by placing thermometer
into the water in the flask for one minute. (Take
out, clean and dry thermometer.)
- Calculate the soil particle density using the
Soil Particle Density Data Sheet.
16
Laboratory Analysis
Soil Fertility Measurements
Follow the directions in the GLOBE soil test kit
to determine the fertility of the soil (N, P,
and K)
Nitrogen (N) Plants use Nitrogen to make amino
acids and proteins. Phosphorus (P) Phosphorus is
a source of energy for plant cells. Potassium
(K) Plants use Potassium to aid in chlorophyll
production and other activities
17
Laboratory Analysis
Soil Fertility Measurements
Soils that have clay particles and organic matter
usually have a negative charge.
NO3-
Soil in low pH (acidic) conditions
K
PO4-3
NO3-
Clay Particle
K
NO3-
AlPO4
18
Laboratory Analysis
Soil Fertility Measurements (continued)
Soils that have clay particles and organic matter
usually have a negative charge.
NO3-
Soil in high pH (basic) conditions
K
PO4-3
NO3-
Clay Particle
K
NO3-
CaHPO4


