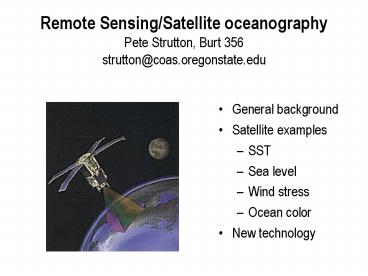
General background PowerPoint PPT Presentation
1 / 34
Title: General background
1
Remote Sensing/Satellite oceanography Pete
Strutton, Burt 356 strutton_at_coas.oregonstate.edu
- General background
- Satellite examples
- SST
- Sea level
- Wind stress
- Ocean color
- New technology
2
(No Transcript)
3
Why Satellites?
- Oceans are vast and sparsely occupied
- Harsh environment for acquiring measurements
- Satellites can acquire measurements quickly over
large areas - BUT
- Cost, risk
- Must measure through intervening atmosphere
- Cant acquire sub-surface measurements
4
(No Transcript)
5
Components of a remote sensing system
sensor
source
raw data
signal
processing / dissemination
calibration/ validation
6
Geostationary Orbit Polar Orbit 36,000km
altitude (for wide view) 850km altitude Stays
over same location Travels over poles Can
document evolving systems Sees whole globe
High temporal resolution Low temporal
resolution Lower spatial resolution Higher
spatial resolution
7
Sea Surface Temperature (SST)
- Perhaps the most standard measurement from
satellites - Traditionally used infrared (IR) emission
- obscured by clouds
- More recently using Microwave
- can see through clouds
- microwave also provides other data such as water
vapor, rain, ice - Temperature important because of its relationship
to heat budget (global warming) and because its
diagnostic of currents, upwelling etc
8
(No Transcript)
9
Advanced Very High ResolutionRadiometer (AVHRR)
- Passive measurement
- Obscured by clouds
- Requires averaging to get good spatial coverage
- Image at right is 8 days, Jul 2006
10
Microwave SSTSees through clouds, but obscured
by rain
11
(No Transcript)
12
(No Transcript)
13
Sea Surface Height (SSH)
- Active measurement using microwave
- Pulse sent from satellite to earth, measure
return time - With appropriate processing and averaging, it is
possible to calculate - Deviations in ocean surface due to bathymetry
- Deviations in ocean surface due to internal
physical variability - Discern ocean currents, eddies etc
14
(No Transcript)
15
Global Map of Seafloor Topography Based on
Altimetry
http//ibis.grdl.noaa.gov/cgi-bin/bathy/bathD.pl
16
(No Transcript)
17
(No Transcript)
18
Wind Stress
- Active measurement, using microwave
- Pulse sent from satellite to ocean surface, then
scattered depending on surface roughness - Surface roughness a function of wind stress
- Strength of return to satellite gives wind stress
and direction
19
Scatterometry
20
(No Transcript)
21
(No Transcript)
22
Ocean color (chlorophyll)
- Passive measurement
- Measures light emitted from the ocean - its
color (careful to distinguish between
emission and reflection) - Most of the signal (gt90) at the satellite is NOT
ocean color - atmospheric interference
23
Sea-viewing Wide Field-of-view Sensor
SeaWiFS8-channels, 1km pixel
Main signals Atmosphere,reflection and ocean
color
Lw
Et
24
Measuring chlorophyll from space
The Sea-viewing Wide Field of view Sensor SeaWiFS
The satellite
The instrument
25
What SeaWiFS sees in one day
26
Other remote sensingMoorings, gliders, floats
and AUVs
- Critical problem in oceanography of undersampling
- Large ships are expensive (20K per day)
- Ocean is vast
- Extremely difficult to sample even small areas
- Satellites help, but only sample the surface
- Need more automated subsurface sampling
- Challenges Power, cost and hostile environment
- (salt water, fouling)
- Could potentially make huge advances in global
coverage
27
Ocean observing technology Old school
28
Ocean observing technology New school
29
Ocean observing technology New school
30
Awesome global coverage!
Imagine these floats with bio/chem sensors
31
New technology Large Observatories
32
New technology Autonomous underwater vehicles
33
Gliders
34
Summary
- Oceanography has traditionally faced a sampling
limitation - Satellites allow us to observe large areas
quickly, but - Only surface, and careful calibration/processing
required - Careful data handling required for long term
data sets - Parameters include SST, altimetry, winds, ice,
water vapor, rain, chlorophyll, fluorescence
(productivity) - Other technologies evolving, both platforms and
sensors - Need to get smaller and more power efficient
- Need skilled people to analyze data and advance
the science

