Lecture 10: Medical Cartography Spatial Analysis Overview - PowerPoint PPT Presentation
1 / 23
Title:
Lecture 10: Medical Cartography Spatial Analysis Overview
Description:
... Acland also drew maps of other features, ... famous map showed the cluster of cases around the water pump in Broad Street in ... Regional Variations (UK) ... – PowerPoint PPT presentation
Number of Views:67
Avg rating:3.0/5.0
Title: Lecture 10: Medical Cartography Spatial Analysis Overview
1
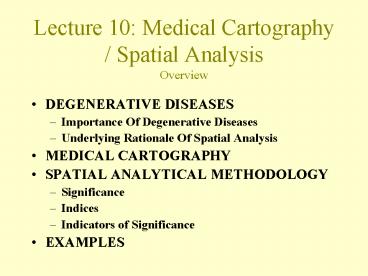
Lecture 10 Medical Cartography / Spatial
AnalysisOverview
- DEGENERATIVE DISEASES
- Importance Of Degenerative Diseases
- Underlying Rationale Of Spatial Analysis
- MEDICAL CARTOGRAPHY
- SPATIAL ANALYTICAL METHODOLOGY
- Significance
- Indices
- Indicators of Significance
- EXAMPLES
2
Degenerative Diseases
- Following the decline in infectious diseases, the
three major degenerative diseases (heart disease,
cancer and stroke) account for 2/3 of all deaths.
Many of the remaining 1/3 are triggered by
degenerative complaints. - The key questions are
- Are the disparities between areas in disease
rates simply due to chance or caused by
something? - If they are caused by something, can we identify
what the something is? - Having identified a cause, can we do anything to
prevent it? - The first question involves mapping diseases and
testing for statistical significance.
3
(No Transcript)
4
Medical Cartography (1)
- The basic principles can be demonstrated using
historical examples of cholera maps from the
mid-19th century. - Augustus Peterman (1852). Dots are used to locate
cases at national level. Main points are ports as
points of entry and the importance of rivers. - Rabert Baker (1833). One of earliest maps.
Cholera areas in Leeds were shaded in,
highlighting the north-east quadrant. - Thomas Shapter (1849). Dots were used to identify
cases. The southern quadrant close to the river
is highlighted.
5
(No Transcript)
6
(No Transcript)
7
(No Transcript)
8
Medical Cartography (2)
- Henry Wentworth Acland (1856). Dots were used to
identify cases in Oxford. However, Acland also
drew maps of other features, including altitude
and undrained areas. The maps can be compared in
much the same way as they would be in a modern
GIS. - John Snow (1855). Snows famous map showed the
cluster of cases around the water pump in Broad
Street in Soho which resulted in 500 deaths in 10
days. Once the pump was disabled, the epidemic
receded almost immediately demonstrating that
cholera was somehow linked with the water supply.
9
(No Transcript)
10
(No Transcript)
11
(No Transcript)
12
Spatial Analytical Methodology
- Meaning of significance. Unlikely to have
occurred by chance, therefore something must be
causing it. - Indices. Crude death rates / crude morbidity
rates can be very misleading. Need to calculate
age specific or age standardised rates. - Indications of spatial significance extreme
variations between areas spatial autocorrelation
(clustering) temporal consistency. - Hypothesis testing. If the distributions of a
disease is found to be significant, then the
objective is to identify possible causes i.e.
factors having a similar spatial distribution.
13
Regional Variations (UK)
- There is a marked difference in mortality rates
between the south-east (low) and the north and
west (high). - Mortality rates tend to reflect affluence.
- Urban areas have higher mortality than rural
areas. - These patterns have not changed much over the
past 100 years. - The death rates translate into a difference of
approximately 4 years in life expectancy.
14
Males
Females
15
Life expectancies at birth
16
Regional Variations In Ireland
- Mortality rates are higher in urban areas (and
urbanised counties). - The regional pattern in Ireland was unusual in
the 1970s because the more deprived regions
tended to have lower mortality rates. - The regional anomalies appear to be breaking down
in the 1990s.
17
(No Transcript)
18
(No Transcript)
19
Intra-Urban Variations
- Comparatively little is known about intra-urban
variations in Ireland. - 1980s data suggest that mortality from heart
disease, cancer and respiratory diseases tended
to be highest in working class suburbs. - Deaths from cerebrovascular disease tended to be
highest in inner city areas.
20
(No Transcript)
21
(No Transcript)
22
(No Transcript)
23
(No Transcript)


