
Information Visualization PowerPoint PPT Presentations
All Time
Recommended

Information Visualization Speaker: Dr. Norman Soong
| PowerPoint PPT presentation | free to download

... of information to facilitate reasoning to uncover new facts or relationships ... Need to add .Double (strange design) Rectangle2D.Double ...
| PowerPoint PPT presentation | free to view

... a problem, but extracting value from information collections has become ... Network models (Lam & Lee, 1999; Ng et al., 1997; Wiener, 1995) Clustering ...
| PowerPoint PPT presentation | free to view

News, Weather, Traffic, Sports scores, Articles, Pictures, Financial information, ... 'The purpose of visualization is insight, not pictures' ...
| PowerPoint PPT presentation | free to view
SIMS 247 Information Visualization and Presentation Marti Hearst March 15, 2002 Outline Why Text is Tough Visualizing Concept Spaces Clusters Category Hierarchies ...
| PowerPoint PPT presentation | free to download

Cognitive artifacts e.g. Post-it notes, bookmarks, wedding ring. Information design ... The structures combine spatial substrates, marks and graphical properties. ...
| PowerPoint PPT presentation | free to download

Human Knowledge Seeking and Information Visualization Exploring New Possibilities Dr. Ray Uzwyshyn University of West Florida Libraries Information Systems ...
| PowerPoint PPT presentation | free to view

SIMS 247 Information Visualization and Presentation Prof. Marti Hearst January 25, 2002 What is Information Visualization? visualize: to form a mental image or vision ...
| PowerPoint PPT presentation | free to download

data mining from data warehouses and data marts knowledge ... visual-information-seeking mantra overview first, zoom and filter, then details on demand ...
| PowerPoint PPT presentation | free to download

Relative Expressiveness of Visual Cues. Visual Illusions. Tufte's notions. Graphical Excellence ... Illusions and the Relation to Graphical Integrity ...
| PowerPoint PPT presentation | free to download

Information Visualization: Principles, Promise, and Pragmatics Marti Hearst CHI 2003 Tutorial Agenda Introduction Visual Principles Design Guidelines Using ...
| PowerPoint PPT presentation | free to download

Growing amount of information within a single image ... 14th century. Roman Britain ... Recent surveys on Tree maps: http://www.cs.umd.edu/hcil/treemap-history ...
| PowerPoint PPT presentation | free to view

not practical. No instant mapping and visualizing. Not easy to be ... Applications that 'Look great' do not ... No practical applications. A ...
| PowerPoint PPT presentation | free to view

Information Visualization as an aid to Agile Software Development By: Andrew J. Armstrong Agile Software Development Overview[4] Manifesto Individuals and ...
| PowerPoint PPT presentation | free to download

ResultMaps: Search Result Visualization for Hierarchical Information Spaces Danielle H. Lee ResultMap demo http://hcc.cc.gatech.edu/ Treemap based visualization in ...
| PowerPoint PPT presentation | free to download

Botanical Tree metaphor is a new method for the visualization of huge ... The information in this visualization is arranged as branches and leaves on a botanical tree. ...
| PowerPoint PPT presentation | free to view

The data visualization tool is an efficient tool that represents any specific information through visual elements like charts, graphs, and maps. It is a simple method to see and understand the trends and patterns through graphical representation. These tools play an important role in making any specific information visually appealing. This way a large number of visitors to a website can easily understand the information that is published on a web page. Read more on https://bit.ly/2v4lXaC
| PowerPoint PPT presentation | free to download

BioPortal: Disease and Bioagent Information Sharing, Surveillance, Analysis, and Visualization
| PowerPoint PPT presentation | free to view

A limited set of visual properties are processed preattentively ... Classifying Visual Representations. Lohse, G L; Biolsi, K; Walker, N and H H Rueter, ...
| PowerPoint PPT presentation | free to view

BioPortal: Disease and Bioagent Information Sharing, Surveillance, Analysis, and Visualization
| PowerPoint PPT presentation | free to view

I've been something of a renowned InfoViz crank on this mailing list... Liar! Information Architecture Summit 2004. 6. Skepticism on information visualization ...
| PowerPoint PPT presentation | free to view

Information Visualization for Intrusion Detection Analysis: A Needs Assessment of Security Experts John Goodall, Anita Komlodi, Wayne G. Lutters
| PowerPoint PPT presentation | free to view

Visualization with a Light Touch: Orbitz.com. 40. Visualization with a Light Touch: Orbitz.com. 41. Flash Class! Fridays 1-3pm ...
| PowerPoint PPT presentation | free to view

http://beginnerdiary.com/information-marketing-business-review
| PowerPoint PPT presentation | free to download

Visualization of Spatial Data in Marine Biogeographic Information Systems ... Biogeographic information systems allow the exploration of spatial patterns of ...
| PowerPoint PPT presentation | free to download

Presenting Directories. Problems ... SeeSys visualizes subsystem, directory, and file statistics, but within ... Identify directories and subsystems with ...
| PowerPoint PPT presentation | free to download

Information Visualization INFORMS Roundtable Ben Shneiderman bencs'umd'edu Founding Director 1983200
| PowerPoint PPT presentation | free to view

Apply service-oriented architecture to information visualization ... Service-oriented architecture (SoA) for information visualization. Technology ...
| PowerPoint PPT presentation | free to view

Member, Institutes for Advanced Computer Studies & Systems Research ... Information Visualization: Mantra. Overview, zoom & filter, details-on-demand ...
| PowerPoint PPT presentation | free to download

Information Visualization INFORMS Roundtable Ben Shneiderman bencs'umd'edu Founding Director 1983200
| PowerPoint PPT presentation | free to download
... of Visual Cues. Visual Illusions. Tufte's notions ... Visual Illusions. People don't perceive length, area, angle, brightness they way they 'should' ...
| PowerPoint PPT presentation | free to download

Our Company one of the best Company in Architectural Visualization, 3D Animators, we've been delivering high quality Visualizations and Rendering for further information please visit http://unitedrenderworks.com/about.cfm
| PowerPoint PPT presentation | free to download
❖ Data Visualization training is provided by Global Online Training which is one of the top online training institutions in India. ❖ We are providing the best Data Visualization training at an affordable cost. Before div into the Data Visualization training details, let’s have a look at some basic concepts of Data Visualization. ❖ Data Visualization is nothing but a graphical representation of the information.
| PowerPoint PPT presentation | free to download

Infographics are a powerful tool for visual communication, simplifying complex information into easily digestible visuals. To create effective infographics, one must learn their value and purpose, as well as master design software and data visualization techniques. These visual aids play a crucial role in simplifying data, enhancing storytelling, and increasing audience engagement by being visually appealing, concise, and informative. By understanding the importance of infographics and mastering the necessary skills, individuals can effectively harness the power of visual communication to convey information in a compelling and engaging manner.
| PowerPoint PPT presentation | free to download
This presentation will educate you about Data visulization, Why is data visualization important?, Benefits of data visualization, Benefits of data visualization and Some other popular techniques are as follows. for more topic stay tuned with Learnbay
| PowerPoint PPT presentation | free to download

❖ Data Visualization training is provided by Global Online Training which is one of the top online training institutions in India. ❖ We are providing the best Data Visualization training at an affordable cost. Before div into the Data Visualization training details, let’s have a look at some basic concepts of Data Visualization. ❖ Data Visualization is nothing but a graphical representation of the information. ❖ The benefit of the data visualization is it actually provides the great insights into the complex data sets. We have been observing that information graphics have become a key tool of the internet media.
| PowerPoint PPT presentation | free to download

Infographics are popular for their visual appeal and clear presentation of complex information. They are unique visual representations of data created with creativity and innovation. In education, infographics are used as tools to help students grasp information better. They differ from memes, which are humorous images or videos with text, as infographics focus on conveying information effectively. The theory behind infographics, known as infographic theory, includes principles and techniques for creating them, such as design elements, data visualization, and storytelling. Infographics are widely shared on social media and might include humor, but their main purpose is to convey information efficiently through visual means.
| PowerPoint PPT presentation | free to download

Title: Knowledge Visualization Author: tina Last modified by: tina Created Date: 5/2/2006 3:18:16 PM Document presentation format: Bildschirmpr sentation
| PowerPoint PPT presentation | free to view

Infographics are a powerful tool for presenting complex information in a visually appealing way. They have a long history and are now a crucial part of modern communication. By combining text, images, and data, infographics create engaging narratives that help viewers understand and remember information easily. The main purpose of an infographic is to simplify data and convey important messages effectively. With their ability to captivate and inform, infographics are widely used across different platforms to share information efficiently.
| PowerPoint PPT presentation | free to download

Which of these is a cartographic visualization? Different maps, same domain ... Exploratory map-based visualization of variations in health statistics ...
| PowerPoint PPT presentation | free to download
The role of visualization in the process of data mining. The patterns being sought: clusters ... Use visualization techniques to steer the data mining process. ...
| PowerPoint PPT presentation | free to download
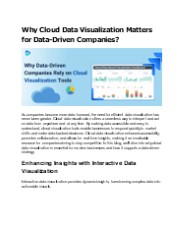
Cloud data visualization offers key benefits for growing businesses by providing real-time insights that support data-driven decisions. It enables companies to reduce data silos, improve collaboration, and leverage analytics for strategic growth, helping teams align with organizational goals and drive sustainable success.
| PowerPoint PPT presentation | free to download

Information Foraging
| PowerPoint PPT presentation | free to view
Science versus Aesthetics. Data Visualization: Brief History. Literature Overview: ... Visual Explanations: Images and Quantities, Evidence and Narrative, 1997 ...
| PowerPoint PPT presentation | free to download
Tarantula. A visualization for automated software test suite results ... Tarantula provides a high-level overview of how the software functions under testing ...
| PowerPoint PPT presentation | free to download

Visual Information Systems visual information retrieval
| PowerPoint PPT presentation | free to view

Information Representation and Visualization ... Information Representation and Visualization. Visual integration across database systems ...
| PowerPoint PPT presentation | free to view

Data visualization has been viewed by many disciplines as a modern equivalent of visual communication. It finds interpretation across many and is not owned by anyone fields. It involves the study and creation of the visual representation of data, which means that information that is being abstracted in some schematic form includes variables or attributes for the units of information. So if you are looking for assignment help services for Data Visualization Course, then you can find it here - https://www.assignments4u.com/data-visualization-assignment/
| PowerPoint PPT presentation | free to download

The art of using visual thinking to understand complex information. Origin (maps) ... data used by Fox news to show the results for the recent presidential election ...
| PowerPoint PPT presentation | free to view

Infographics are visual representations of information that can be saved by right-clicking and selecting "Save Image As". They often feature pictures and are used to simplify complex ideas. Science infographics focus on presenting scientific data in a visually appealing manner. To find infographics, one can search online on websites or social media platforms. While a GIF can be an image file, it is not necessarily an infographic unless it conveys information graphically. Infographics are valuable tools for engaging audiences and making complex concepts easier to understand.
| PowerPoint PPT presentation | free to download

It so occurs, that public is in the want for illustrations of information that consent to the onlookers to relate and interact with the data.
| PowerPoint PPT presentation | free to download

Do you have questions like What is data visualization and Why it is given so much importance across the companies then check out this PPT to find out the benefits of using Data visualization for companies. For more information about data visualization visit https://intellectyx.com
| PowerPoint PPT presentation | free to download

Software Visualization. A Task ... Match the Method to the Task ... Form, Method, Interaction, Effectiveness. Specification method, Interface, Presentation ...
| PowerPoint PPT presentation | free to download

Geographic information system (GIS) is a computerized tool that helps in gathering, managing, and analysing spatial and geographic data. A geographic information system (GIS) is a conceptualized framework that integrates different types of data into visualizations using maps and 3D techniques. https://www.databridgemarketresearch.com/reports/global-geographic-information-system-gis-software-market
| PowerPoint PPT presentation | free to download
Data Visualization Training is a graphical representation of the information.We provide D3.js online training and corporate training by real time experts.
| PowerPoint PPT presentation | free to download

Geographic information system (GIS) is a computerized tool that helps in gathering, managing, and analysing spatial and geographic data. A geographic information system (GIS) is a conceptualized framework that integrates different types of data into visualizations using maps and 3D techniques.
| PowerPoint PPT presentation | free to download