Prsentation PowerPoint PowerPoint PPT Presentation
1 / 1
Title: Prsentation PowerPoint
1
Analyse de la variabilité de la structure
verticale équatoriale des sorties de
MERCATOR Boris Dewitte, Lionel Gourdeau, Séréna
Illig, Jacques Verron, and Jérome
Vialard Résumé du projet Les océans tropicaux
sont caractérisés par une stratification
verticale très marquée. Dans le cadre de
Mercator, nous allons étudier comment
lassimilation a propagé en subsurface
linformation de surface assimilée. A partir
dune décomposition en mode verticaux de la
variabilité des sorties Mercator, la contribution
des différents modes baroclines aux anomalies de
courant et de pression sera estimée. Ce
diagnostic est particulièrement adapté à la bande
équatoriale étant donné sa dynamique
quasi-linéaire. Létude portera particulièrement
sur les océans tropicaux Pacifique et Atlantique
où léquipe a déjà une expertise. Cette analyse
doit permettre non seulement de vérifier la
cohérence des sorties MERCATOR du point de vue
des mécanismes physiques mis en jeux, mais doit
aussi permettre dapprofondir des études de
mécanismes liés à la propagation des ondes
équatoriales qui jouent un rôle crucial dans le
développement des événements El Niño. En
attendant les sorties de POG et dORCA 2, nous
allons utiliser la ré-analyse disponible MNATL
sur la période 1993-2000 pour lAtlantique. Cette
analyse a déjà été faite sur le Pacifique à
partir dune assimilation de SLA TOPEX/POSEIDON
pour la période 1994-1999 dans la version TDH
dOPA par le filtre SEEK. Je présente ici
quelques résultats.
A. AN ASSIMILATION EXPERIMENT The model The OPA
Ocean General Circulation Model Madec et al.,
1999 is used. The domain covers the tropical
Pacific from 120E to 75W, 30N to 30S, with
realistic coastline and bathymetry. The zonal
resolution is 1, and the meridional resolution
varies from 0.5 in the equatorial wave-guide to
2 at the northern and southern boundaries. There
are 25 vertical levels with a 10 meter resolution
at the surface down to 120 meters. The surface
fluxes of momentum results from a combination of
ERS1-2 scatterometer derived wind stresses and
TAO derived stresses Menkes et al., 1998. The
other surface boundary conditions come from the
NCEP/NCAR reanalysis. SST and SSS fields are
relaxed towards observed SST Reynolds and Smith,
1994and climatological SSS. The SEEK filter
The assimilation method used, named the SEEK
filter, is sequential and based on a reduced
order extended Kalman filter. The reduced space
is defined through a convenient MEOF analysis of
free model outputs. The SEEK filter is applied
to the assimilation of the T/PERS data into the
OPA model. Gridded data are assimilated every 10
days. The assimilation experiment was performed
over a 5-year period of the T/P mission from Jan.
1994 to Jul. 1999. The output used from the
assimilation experiments is the forecast state,
sampled every 10 days. The data The gridded sea
level anomaly data (SLA) were supplied by
AVISO/altimetry. They were built by optimal
interpolation of T/P and ERS data on a 1/4
1/4 grid every ten days. Subsurface temperature
data base provided by the BMRC in Australia, and
in situ temperature and current data from the TAO
array were used to validate the assimilation
results. Validation results Results from the
assimilation of the 1994-1999 Topex/Poseidon sea
level anomalies in the tropical Pacific OPA model
are presented in Parent et al. 2002, and an
analysis in term of vertical mode contribution is
presened in Dewitte et al. 2002. Here, we just
recall some notable effects of this assimilation.
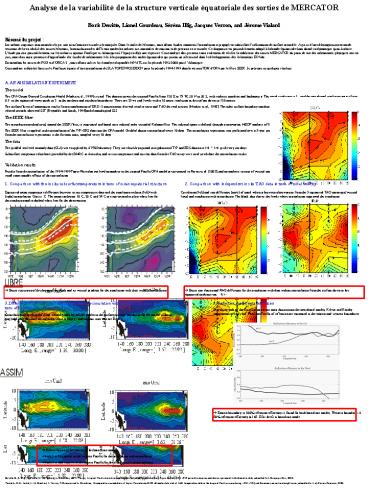
1. Comparison with the in situ subsurface
temperature in term of mean equatorial structure
2. Comparison with independent in situ TAO data
in term of zonal velocity
Equatorial mean temperature difference between in
situ temperature data and the simulation without
(left)/with (right) assimilation. Unit is C. The
mean isotherms 16C, 20C and 24C are
represented in plain white line for the
simulation and in dashed white line for the
observations.
Correlation (left) and rms difference (cm/s) of
zonal velocity between observations from the 5
equatorial TAO moorings (vertical lines) and
simulation with assimilation. The black dots
shows the levels where assimilation improved the
simulation
? Better restitution of the thermocline depth and
its vertical gradient for the simulation with
than without assimilation
? Better correlation and RMS difference for the
simulation with than without assimilation from
the surface down to the equatorial undercurrent
3. Difference of surface zonal velocity between
the simulation with and without assimilation in
term of baroclinic mode contribution
4. Reflection coefficients estimation Projecting
each of the first two baroclinic contribution
onto the meridional modes, Kelvin and Rossby
components are derived. Their coefficient of
reflection are estimated at the eastern and
western boundaries.
Contribution of the first (left) and second
(right) baroclinic modes to the surface currents
variability for the model without (top) and with
(bottom) assimilation. Units are cm s-1 and
contour intervals are 4 cm s-1.
? Eastern boundary a 100 reflection efficiency
is found for both baroclinic modes Western
boundary A 50 reflection efficiency at 165E
for the first baroclinic mode
? Redistribution of the energy of the baroclinic
modes - Mode 1 is less active in the western
Pacific for the simulation with assimilation -
Mode 2 is more active in the eastern Pacific for
the simulation with assimilation
Dewitte B., S. Illig., L. Parent, Y. DuPenhoat,
L. Gourdeau, and J. Verron, Tropical Pacific
baroclinic mode contribution and associated long
waves for the 1994-1999 period from an
assimilation experiment with altimetric data,
submitted to J. Geophys. Res., 2002. Parent L.
C.-E. Testut, J.-M. Brankart, J. Verron, P.
Brasseur and L. Gourdeau, Comparative
assimilation of Topex/Poseidon and ERS altimeter
data and of TAO temperature data in the tropical
Pacific ocean during 1994-1998, and the mean
sea-surface height issue, submitted to J. of
Marine Research, 2002.

