
Prsentation PowerPoint - PowerPoint PPT Presentation
1 / 1
Title:
Prsentation PowerPoint
Description:
... also be applied to individual congeners if their levels in the pattern ... the MU assessed in toxicological units is linked to the congener profile of the ... – PowerPoint PPT presentation
Number of Views:25
Avg rating:3.0/5.0
Title: Prsentation PowerPoint
1
Introduction
Very different approaches for evaluating
measurement uncertainty (MU) are found in the
literature and in dedicated guidelines1-3. The
one published by Eurachem in 2000 was dedicated
to analytical chemists and illustrated with
practical examples. It defines uncertainty as a
parameter associated with the result of a
measurement, that characterizes the dispersion of
the values that could reasonably be attributed to
the measurand. The parameter can be a standard
deviation or the width of a confidence interval.
This confidence interval represents the interval
on the measurement whithin which the true value
is believe to lie at a specified probability if
all relevant sources of error have been taken
into account (i.e. represented by the expanded
uncertainty U(x) with a coverage factor k).
Within this interval, the result is regarded as
being accurate, i.e. precise and true. However,
one should note that MU is different from error.
The error (random and systematic) is the
difference between an analytical result and the
true value while the uncertainty (derived from
the errors) is a range and no part of the
uncertainty can be corrected for. Recently,
Boulanger, Hubert and co-workers introduced a
concept based on the ? expectation tolerance
interval 4 and on the concept of total error
called the accuracy profile 5, 6. Basically,
the idea behind this approach is that a result X
which differs from the unknown true value µ of an
analyzed sample is less than an acceptability
limit ?. ? depends on the objectives of the
analytical procedure. Initially, the accuracy
profile was dedicated to the validation of an
analytical method and the profile was constructed
from the available estimates of the bias and
precision of the method at each concentration
level. This confidence interval corresponds to
the ? expectation tolerance interval introduced
by Mee 4. In addition, Feinberg et al
demonstrated that the uncertainty as defined in
the ISO/TS 21748 document 7 and limited to
statistical estimation equals the total variance
of the ?-expectation tolerance interval 8. It
was then possible to use this variance as an
estimate of the MU for each concentration in the
accuracy profile. Thus, all these concepts are
fully in agreement with the ISO definition of MU
and its interval within which a result is
regarded as being accurate. It is however
possible to extend this concept of accuracy
profile to the environment of routine analysis
and quality control.
Experimental
Three spiked quality control of beef fat at
levels below and above the maximum levels (i.e.
3pg-TEQ/ g lipids) were selected. For each level,
a series of ten replicates was performed in order
to estimate the repeatability standard deviation
(sW) of the method. In addition, The IQCs were
afterwards implemented as statistical quality
control with routine series of samples for long
term intermediate method precision and bias
assessment. 7 grams of fat were loaded on a
Power-Prep system for clean-up. Analyses were
performed by GC/HRMS
Results and Discussion
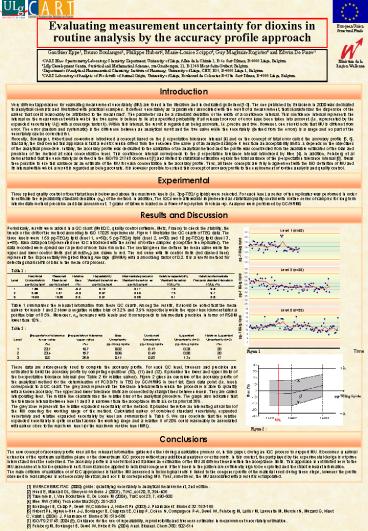
Periodically, results were added in a QC chart
(MultiQC, quality control software, Metz, France)
to check the stability, the trends or the drift
of the method according to ISO 17025
requirements. Figure 1 illustrates the QC charts
of TEQ data. The three levels were 1.69 pg-TEQ/g
lipid (level 1, n50) 5 pg-TEQ/g lipid (level 2,
n80) and 10 pg-TEQ/g lipid (level 3, n88). Each
data point represented one IQC introduced with
the series of routine samples (except the ten
replicates). The data recorded were spread over a
period of more than 6 months. The central green
line defines the mean value while the upper and
lower control limits (set at m?3sM) are drawn in
red. The red curve with its control limits (red
dashed lines) represents the Exponentially
Weighted Moving Average (EWMA) with a smoothing
factor of 0.2. It is a useful method for
detecting small shifts or bias in the mean of a
process.
Table 1
Table 1 summarises the relevant information from
these QC charts. Among the results, it should be
noted that the mean values for levels 1 and 2
show a negative relative bias of 3.2 and 3.9
respectively while the upper level demonstrates a
positive bias of 8.5. Moreover, sM increases
with levels and it corresponds to intermediate
precision in terms of RSDM lower than 10.
Table 2
Figure 1
These data are subsequently used to compute the
accuracy profile. For each QC level, trueness and
precision are estimated to build the accuracy
profile by computing equations (10), (11) and
(12). It provides the lower and upper limits of
the b-expectation tolerance interval (see Table 2
for relative values). Figure 2 gives an overview
of the accuracy profile of the analytical method
for the determination of PCDD/Fs in TEQ by
GC/HRMS in beef fat. Each data point (i.e. level)
corresponds to a QC chart. The grey area
represents the tolerance interval within which
the procedure is able to quantify with a known
accuracy. The upper and lower tolerance limits
are connected by straight lines between levels.
They are called interpolating lines. The middle
line characterizes the relative bias of the
analytical procedure. The graph also indicates
that the tolerance interval between level 1 and 3
is narrower than the acceptance limits ? ? set a
priori at 35. The grey zone represents the
relative expanded uncertainty of the method. It
provides therefore an interesting visual tool of
the MU covering the working range of the method.
Calculated values of combined standard
uncertainty, expanded uncertainty and relative
expanded uncertainty by level are summarized in
Table 5. We can conclude that the relative
expanded uncertainty is quite constant across the
working range and a relative U of 20 could
reasonably be associated with values close to the
maximum level (or the maximum residue level MRL).
Figure 2
Conclusions
The new concept of accuracy profile uses all the
relevant information gathered either during a
validation process or, in this paper, during an
IQC process to support MU. It becomes a natural
extension of the upstream validation phase or the
downstream IQC process without any additional
analyses or extra costs. In this context, the
part played by the experimental design is of
prime interest and must be underlined. The
accuracy profile is a useful tool and it allows
an estimation of the MU at different levels
within the acceptance limits. This approach is
not limited here to the MU assessment in toxic
equivalents unit. It could also be applied to
individual congeners if their levels in the
pattern are sufficiently high to be exploited and
to extract relevant information. The main
criticism of validation or of IQC approaches is
that the MU assessed in toxicological units is
linked to the congener profile of the material
used during these steps, however the profile
observed in real samples is not necessary
identical, and nor is its corresponding MU. Thus,
sometimes, the MU associated with a result is
extrapolated.
1 EURACHEM/CITAC (2000) guide quantifying
uncertainty in analytical measurement, 2nd
edition. 2 Hund E, Massart DL, Smeyers-Verbeke
J (2001), TrAC, vol 20, 8, 394-406 3
Taverniers, I, Van Bockstaele E, De Loose M
(2004), TraC vol 23, 7, 490-500 4 Mee RW (1984)
Technometrics26(3) 251-253 5 Boulanger B,
Chiap P, Dewé W, Crommen J, Hubert Ph (2003) J.
Pharmaceut Biomed 32 753-765 6 Hubert Ph,
Nguyen-Huu J-J, Boulanger B, Chapuzet E, Chiap P,
Cohen N, Compagnon P-A, Dewé W, Feinberg M,
Lallier M, Laurentie M, Mercier N, Muzard G,
Nivet C, Valat L (2004) J. Pharmaceut Biomed
36 579-586 7 ISO/TS 21748 2004(E), Guidance
for the use of repeatability, reproducibility and
trueness estimates in measurement uncertainty
estimation. 8 Feinberg M, Boulanger B, Dewé W,
Hubert Ph (2004) Anal. Bioanal. Chem.380 502-514
Recommended
CrystalGraphics Presentations


