LINEAR REGRESSION: On to Predictions! - PowerPoint PPT Presentation

1 / 17
Title:
LINEAR REGRESSION: On to Predictions!
Description:
Or: How to amaze your friends and baffle your enemies Imagine: The correlation between 1 mile run time and VO2 Max is r = -1.0! Suppose you know... – PowerPoint PPT presentation
Number of Views:37
Avg rating:3.0/5.0
Title: LINEAR REGRESSION: On to Predictions!
1
LINEAR REGRESSION On to Predictions!
- Or How to amaze your friends and baffle your
enemies
2
Imagine
- The correlation between 1 mile run time and VO2
Max is r -1.0!
3
Suppose you know...
- that a 630 mile 40 ml/kg/min
- and 600 mile 45 ml/kg/min
- Could you predict what VO2 Max a person would
have who could run a 500 min mile???
4
Of Course you could, by finding the equivalent
point on the line!
5
Mile Time vs. VO2 Max
60
r -1.0
55
VO2 MAX
50
45
40
400
430
500
530
600
630
MILE TIME
6
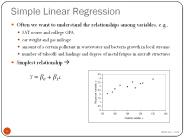
Describing and Defining the LINE
- To describe a line on a graph, we need to know
- The slope
- The point where the line intercepts the y axis
7
More Math?? YabX
- General formula for a straight line
- Calculated from the means, s, r
8
Y a b X
- Y the predicted value of y for a given value of
X - a the point of the y intercept
- b the slope of the line (rise over run)
- X the value of X ( Height) for predicting Y
(Shoe size)
9
Linear Regression
- Maybe you recognize this general equation Y
abX - VO2 111.33 - (0.42 HR)
- Y a (-b X)
- Y dependent variable
- X independent variable
10
How Accurate is the Prediction?
- When the correlation coefficient is equal to 1.0,
then every actual score will fall exactly on the
prediction line. - THERE IS NO ERROR BETWEEN THE ESTIMATED
PREDICTION and REALITY
11
Mile Time vs. VO2 Max
60
r -1.0
55
VO2 MAX
50
45
40
400
430
500
530
600
630
MILE TIME
12
Get Real!
- In the REAL WORLD, it is never so tidy
- There is some deviation between the line and most
points
13
Standard Error of Estimate
- The predicted (estimated) score will not be
exact, there will be a margin of error between
predicted and actual scores. - Thus we need to know the standard deviation of
the prediction error. - The SEE gives one a feel for the accuracy of a
prediction
14
Note the error from predicted?
Prediction Line
Actual Scores
15
Body Composition data Compared to UWW
- Skinfold 7 site
- Skinfold 3 site
- BIA
- Infrared
- Circumference
- r.87 SEE 3.5
- r .87 SEE 3.5
- r.80 SEE 5.0
- r .80 SEE 4.5
- r .75 SEE 7.0
UWW vs dissection SEE 2.0
16
Lets give it a try!
- Lab 4 Predicting Shoe size (dependent variable
- Y) - From Height (independent variable - X)
- First derive the linear regression equation, then
try it out!
17
(No Transcript)
Recommended
CrystalGraphics Presentations