Climate Graphs - PowerPoint PPT Presentation
1 / 6
Title:
Climate Graphs
Description:
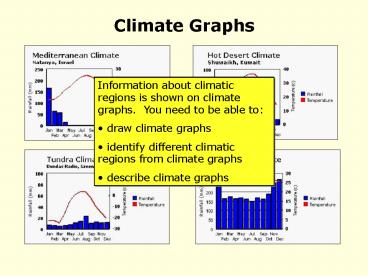
Climate Graphs. Information about climatic regions is shown on climate graphs. ... In Shetland, for example, the average July temperature is 13 C and so would be ... – PowerPoint PPT presentation
Number of Views:175
Avg rating:3.0/5.0
Title: Climate Graphs
1
Climate Graphs
- Information about climatic regions is shown on
climate graphs. You need to be able to - draw climate graphs
- identify different climatic regions from climate
graphs - describe climate graphs
2
How to construct a climate graph
D
N
O
S
A
J
J
M
A
M
F
J
Precip(mm)
252
170
195
190
172
173
170
200
180
210
255
260
26
27
27
28
28
28
28
28
27
27
27
27
Temp(C)
Temperature C
Precipitation mm
X
X
Now complete the bar graph
Now complete the line graph
Your graph should look like Fig 7.3 on pg 51 of
text book!
Months of the year
3
Describing Climate Graphs
- To describe the temperature you should write
about - Highest temperature (amount and month)
- Lowest temperature (amount and month)
- Temperature range (highest minus lowest).
- The describing words for temperature are shown on
the thermometer on the left. - In Shetland, for example, the average July
temperature is 13 C and so would be described as
having a warm summer.
4
- To describe precipitation you should write
about - Highest precipitation (amount and month)
- Lowest rainfall (amount and month)
- Total precipitation.
You can finish your answer by saying something
about the seasonal distribution of temperature
and precipitation e.g. the summer months are warm
and dry.
5
Describe the climate graph that you have drawn.
The maximum temperature is 28C between May and
September. The minimum temperature is 26C in
December. The temperature range is 2C. The
wettest month is January with 260mm. June ( and
November going by the statistics earlier) has the
least rainfall 170mm. It is a very wet climate
with an annual total of 2415mm. This region has
a hot and wet climate all year round.
6
You have just described the climate graph for an
equatorial region. This is the first climatic
region we will be studying
It is good to know the characteristics of the
equatorial climate. Copy down 7E on page 50 of
the textbook.


